![]()

Weekly Market Update by Retirement Lifestyle Advocates
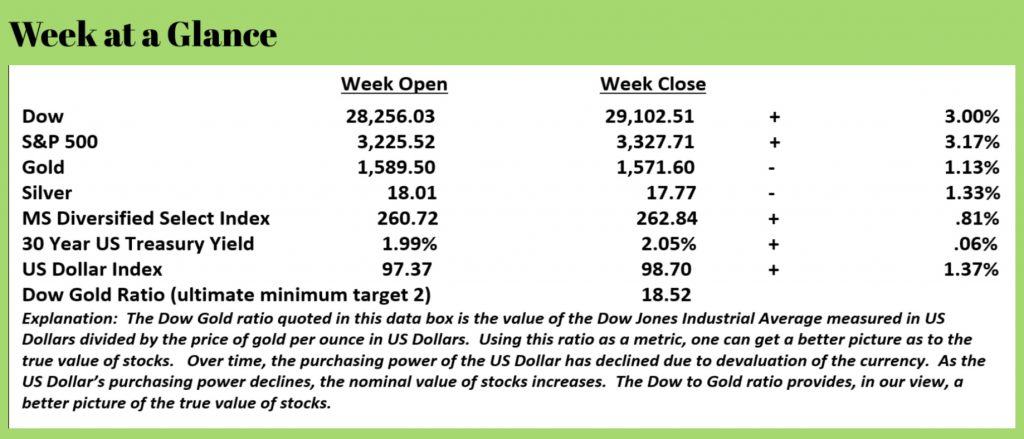
Stocks rebounded
hard last week with the Dow Jones Industrial Average rallying 3% and the
broader S&P 500 advancing 3.17%.
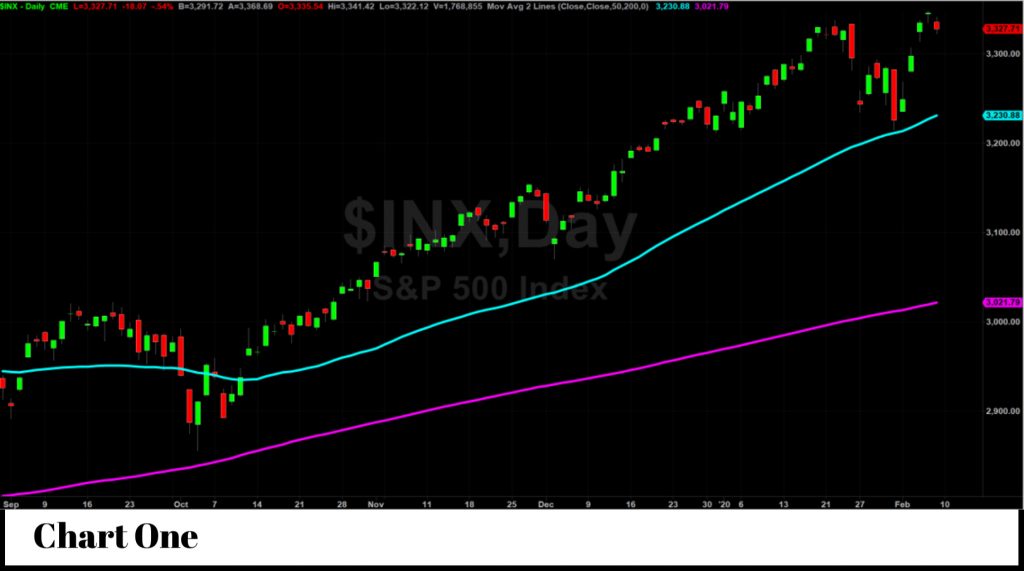
Chart One
shows that stocks made a textbook bounce higher off the 50-day moving
average. The light blue line on the
chart is the 50-day moving average while the violet line on Chart One is the
200-day moving average.
A bounce up
off the 50-day moving average is generally considered to be a bullish indicator
for stocks.
When it
comes to analyzing the performance of stocks, it’s impossible to ignore the correlation
between the Fed’s expanding balance sheet and the rise in stocks. This correlation can be best summed up by
observing – the Fed prints and stocks rally.
Yet, when
looking at the broader economy, despite the recent positive reports, one has to
be concerned with debt levels in the private sector and in the public sector.
This past
week, there was good economic news reported.
We have often noted here that the official unemployment rate is not
necessarily a great metric when it comes to measuring employment due to the
fact that the calculation methodology has changed over the years to make the
official number look more favorable.
The labor
force participation rate is, in our view, a better measure of the true
employment picture.
When
examining the labor force participation rate, one comes to a positive
conclusion. CNS News reported this week
(Source: https://cnsnews.com/article/national/susan-jones/634-labor-force-participation-trump-era-high) that the
labor force participation rate is rising.
This from the article (emphasis added):
The labor force
participation rate reached a Trump-era high of 63.4 percent, up from 63.2 percent
in December, because the civilian labor force increased by 574,000 in
January, after accounting for annual adjustments to population
controls, BLS said.*
In January, the civilian
non-institutional population in the United States was 259,502,000. That
included all people 16 and older who did not live in an institution (such as a
prison, nursing home or long-term care facility).
Of that civilian
non-institutional population, 164,606,000 were participating in the labor
force, meaning that they either had a job or were actively seeking one during
the last month. This resulted in a labor force participation rate of 63.4
percent, the highest it's been since June 2013.
That’s significant improvement using a measure that is more accurate than the official unemployment rate. An increase in the labor force participation rate means that more people are working and are re-entering the workforce.
However, it is less reported that much of the economic expansion that we’re seeing is debt-fueled. Less any of you more politically partisan readers of this newsletter begin to point fingers at one political party or another, we’ll remind you that this trend began more than two decades ago and has been in our view the cause of the bust cycles of 2000-2002 and the meltdown of 2007-2009. Debt can only accumulate to a certain level before the trend has to reverse.
Since the last meltdown, the Fed has been ‘expanding its balance sheet’ a.k.a. printing money. While that has created a level of prosperity, it will ultimately have a price as high levels of debt always need to be dealt with.
There is
presently about $1.6 trillion in student loan debt (Source: https://www.forbes.com/sites/zackfriedman/2020/02/02/student-loans-bernie-sanders-elizabeth-warren/#7c84f2ef35e10), about
$1.2 trillion in automobile debt (Source:
https://www.investopedia.com/personal-finance/american-debt-auto-loan-debt/)
and about $1.1 trillion in credit card debt (Source: https://www.thebalance.com/average-credit-card-debt-u-s-statistics-3305919). That’s about $4 trillion in those three
categories alone.
This will
be a drag on the consumer spending dependent US economy at some future point
since debt can only accumulate on the consumer side to a finite level. Consumers can only collectively accumulate
debt as long as their collective income can service the debt. Once the ability to service the debt stops,
so does debt accumulation.
To put the
$4 trillion number into perspective, that’s enough money to buy nearly 141
million new Ford F-150 pickups. Let that
sink in.
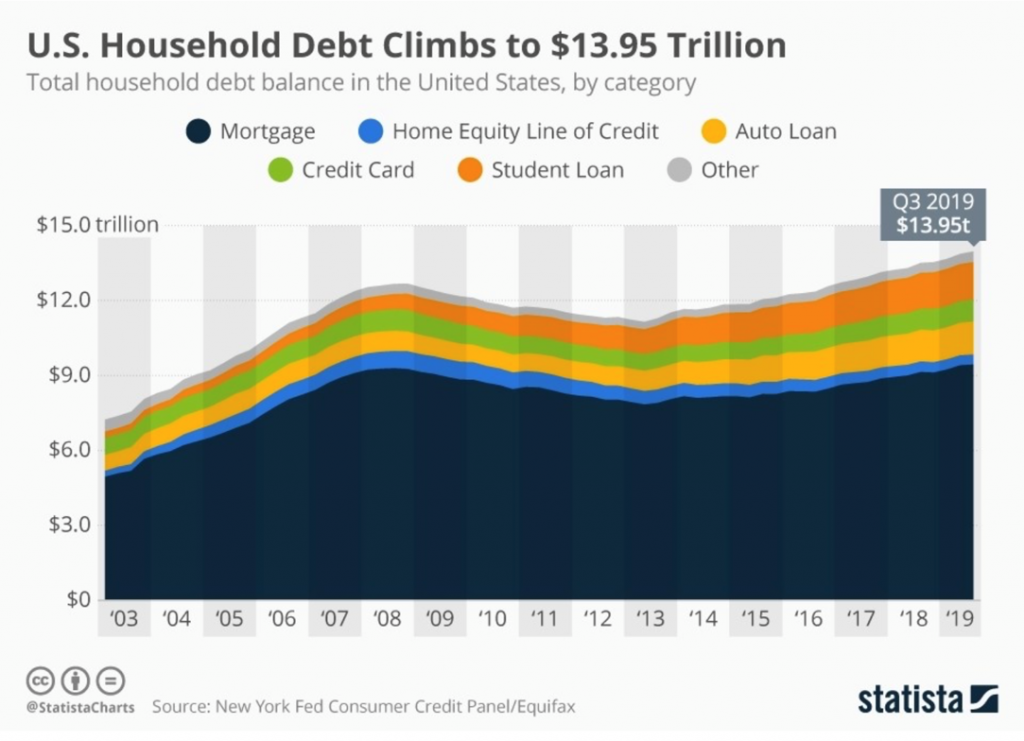
Keep in
mind that level of debt doesn’t include mortgage debt and other forms of
consumer debt. Total household debt is
now about $14 trillion as noted by this chart published by Statista
(Source: https://www.weforum.org/agenda/2019/11/u-s-household-debt-climbs-to-13-95-trillion/).
Notice that
is notably higher than at the time of the last economic bust.
But the
debt doesn’t stop in the private sector.
Public sector debt has also exploded.
The reality is that public sector debt is really private-sector debt since the responsibility for repayment rests squarely on the private sector. (Unless of course, you’re among those who believe that money can be printed indefinitely with no consequences.)
The national debt is now more than $23 trillion and the underfunded liabilities of Social Security are more than $40 trillion. Medicare’s underfunded liabilities are about double that of Social Security. Just these federal liabilities total about $1.5 million per US taxpayer.
And, that
doesn’t consider state and municipal debt.
While there are some municipalities that are fiscally sound, many are
not.
The “2020
Financial State of Cities” reports (Source:
https://www.truthinaccounting.org/library/doclib/Financial-State-of-the-Cities-2020.pdf
) that unfunded debt in the 75 most populous cities was more than $323 billion
combined.
The report
found that taxpayers in the City of New York would each need to cough up more
than $60,000 to get the city back in black ink.
Chicago
residents would need to come up with more than $37,000 per taxpayer.
Honolulu,
Philadelphia and New Orleans round out the bottom five with per taxpayer
liabilities of more than $25,000 in the case of Honolulu and Philadelphia and
more than $18,000 in the case of New Orleans.
Everywhere
you look, massive, unpayable levels of debt exist. Moving ahead, it’s obvious that politicians
and policymakers on the Federal level will be called upon for bailouts. Should the politicians and policymakers
acquiesce, more money will need to be created.
We know how that will end.
This week’s RLA Radio program features the author of “Unbounded Wealth”, John Del Vecchio.
Host, Dennis Tubbergen, chats with John about the George Costanza School of Investing and the world’s richest gym teacher. You’ll want to check it out.
That
show is now available at www.RetirementLifestyleAdvocates.com.
There
are many other valuable resources available on that site as well. We’d encourage you to visit the site and
check it out.
“In a
crisis, don’t hide behind anything or anybody.
They’re going to find you anyway.”
-Bear
Bryant