![]()

Weekly Market Update by Retirement Lifestyle Advocates
Stocks
declined last week as we anticipated they might. Last week we wrote this:
Stocks at
this juncture are overbought in our view.
The chart below illustrates the Standard and Poor’s 500. It is a weekly chart with Bollinger
Bands. Bollinger Bands track price
extremes. Notice that stock prices are
currently near the top Bollinger Band on the chart. Often, when this chart pattern occurs, a
pullback in price follows.
That is
precisely what happened as the Dow and the S&P 500 declined. More decline from here to move stock prices
closer to their longer-term moving average of price would not be surprising.
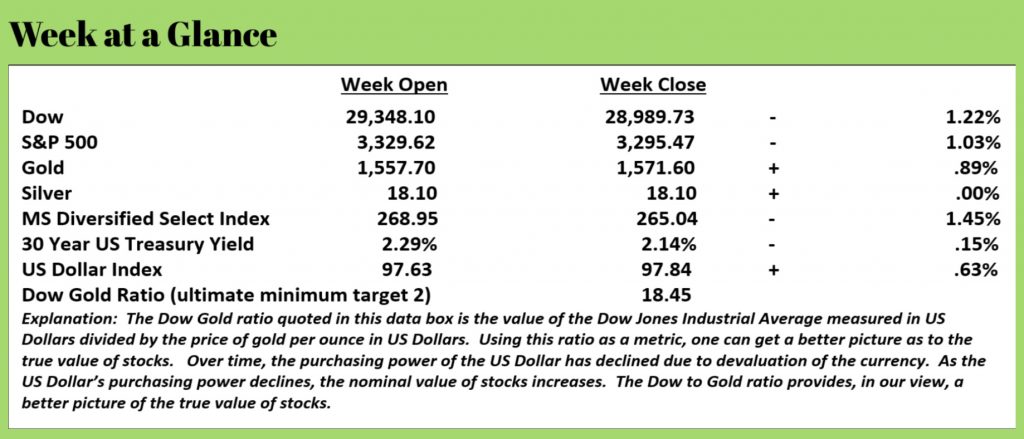
Predictably,
US Treasuries rallied hard with the decline in stocks. The yield on the 30-Year US Treasury Bond
fell to 2.14% as bond prices rose. Gold
prices rallied and silver prices were unchanged from last week.
“Barron’s”
reported that stocks experienced their worst weeks since August. (Source:
https://www.barrons.com/articles/stocks-catch-a-cold-after-fed-stops-expanding-its-balance-sheet-51579916069). Here is an excerpt from the article (emphasis
added):
Interest rates
remain the primary underpinning for stocks, as equity valuations look
stretched, except when compared with the paltry returns offered by the debt
market. Much of the credit for that is owed to the world’s central banks, notably
the Federal Reserve. In addition to last year’s three one-quarter
percentage-point short-term rate cuts, the central bank has expanded its
balance sheet by over $300 billion since September, when ructions in the
repurchase-agreement market led it to inject liquidity. Since then, U.S.
stocks’ value has jumped by more than $3 trillion.
The Fed prints and stocks
rally. It’s a predictable pattern. More from the Barron’s article (emphasis
again added):
The Fed insists that its
operations don’t constitute quantitative easing, as it calls its purchases of
long-term securities intended to boost stock and bond prices. Its recent
operations consist of adding liquidity to the money markets through repurchase
agreements and by buying short-term bills. Others call this a distinction
without difference, given the impact on stock and bond prices.
Interestingly,
the Fed’s balance sheet contracted by $25 billion for the week that ended last Wednesday,
and stocks declined.
Coincidence?
Probably
not in our view.
Money
creation and stock rallies occur in tandem.
Since
September, the Federal Reserve has been ‘injecting liquidity’ into the repo
market. What does that mean exactly?
Simply
put, the repo market is the overnight or short-term lending market between
banks. In September, for some reason
that has not yet been disclosed, some banks refused to lend to other banks or
financial institutions on an overnight basis.
In
our view, there is only one reason for this – the lending banks were concerned
that the borrowing banks could not pay them back. In other words, it’s a red flag of trouble
that may be brewing in the banking sector.
To
ensure that the banks could get the short-term loans that they needed to meet
reserve requirements, the Fed stepped up and provided the loans that the
borrowing banks and financial institutions couldn’t get from other banks.
Where
does the Federal Reserve get the money to loan to these borrowing banks?
They
print it.
Of
course, it’s not reported as straightforwardly as that in the news. As the “Barron’s” article above states, “the
central bank (the Fed) has expanded its balance sheet by over $300 billion
since September”.
“Expanded
its balance sheet” means printed money.
A
visit to the Fed’s website illustrates where the balance sheet was at the
beginning of September and where it is presently. At the beginning of September, prior to
‘injecting liquidity’ into the repo market, the Fed’s balance sheet was just
over $3.7 trillion.
Presently,
it’s approaching $4.2 trillion.
Over
that same time frame, the S&P 500 has increased from about 2,850 to about
3,350.
We’ve
long suggested that Fed policy is driving stocks and while this relationship
between stocks and the Fed’s balance sheet level does not prove anything
conclusively, it is, at the very least, interesting.
The
bottom line is this.
Money
creation to price inflation.
Price
inflation occurs in stocks and in consumer goods.
John
Mauldin, best-selling author and publisher of an excellent weekly newsletter
“Thoughts from the Frontline” had this to say on the topic of inflation in his
newsletter this week (we’ve pulled excerpts) (emphasis added):
Wonks
tell us, with all sincerity, things like “the US cost of living rose 2.1% last
year.” Really? To an actual numerical decimal place? On something as vague and
as complex as inflation? Now, to give them credit, they are looking at the
total national inflation rate and it is extraordinarily complex. They do the
best they can.
But
the inflation you and I experience? They don’t know that.
They can’t know it, at least not with any precision because the cost
of living is so individualized. Everyone spends their money differently, and
the things they spend it on vary in price for many reasons.
I believe
the analysts try to be fair and scientific. They have to work within boundaries
that don’t always make sense. So, we get crazy things like “hedonic
adjustment.” That’s where they modify the price change because the
product you buy today is of higher quality than the one they measured in the
past.
According
to Consumer Price Index data, a television set that cost $1,000 in 1996 is now
$22. You can’t buy any such product today, but the fact you can spend the
same amount of money and get a better TV depresses the inflation rate.
They
do the same thing for cars, as Peter Boockvar noted earlier this month.
Last week Edmonds.com said
the average price of a new vehicle sold in 2019 was $37,183, a new record high
and up 30% from where it was 10 years ago. Within today’s CPI, the price of a
new car reflected a 2% increase in TOTAL since 2009. This is magically done via
hedonic adjustments which discount the value of new add-ons with each
subsequent iteration of cars.
The
Fed relies on hedonically-adjusted data points and not the price that people
are actually paying out of pocket.
Hedonically-adjusted
prices exist only in theory. They don’t reflect what people
actually have a choice of spending.
The Chapwood Index might be a better measure of the actual
inflation rate.
This index compares the retail price of 500 consumer items that
consumers most frequently purchase over different time frames.
Using this arguably more practical measure of inflation, one finds
that the average annual inflation rate over the past five years ranges from 8%
annually in Dallas, Texas to 13% annually in San Jose, California. Mesa, AZ on the low end of the metro areas
tracked, had an average annual inflation rate over five years of 6.6%. On the high end was Oakland, CA with an
average annual inflation rate over five years of 13.1%.
The dollars used to purchase consumer items are the same dollars
used to purchase stocks.
We believe the driving force behind higher consumer prices and
higher stock prices is largely Federal Reserve policy.
The changes in the way the official inflation rate is calculated
has masked this reality.
Given higher debt levels at the government level and trillion
dollar plus deficits as far as the eye can see, this money creation will have
to continue in our view.
To protect yourself, we’d urge you to consider ‘going tangible’
with some of your assets. Tangible assets have physical characteristics and
intrinsic value.
This week’s RLA Radio program features David
McAlvaney.
Mr. McAlvaney is the author of “Intentional
Legacy” and has been in the wealth management industry for more than two
decades.
Host, Dennis
Tubbergen, chats with Mr. McAlvaney about his Canadian based program that is
re-establishing gold as currency.
That
show is now available at www.RetirementLifestyleAdvocates.com.
There
are many other valuable resources available on that site as well. We’d encourage you to visit the site and
check it out.
“If God had wanted man to play soccer, He
wouldn’t have given us arms.”
-Mike
Ditka