![]()

Weekly Market Update by Retirement Lifestyle Advocates
Another
extremely volatile week for stocks. The
fact that stocks finished up for the week doesn’t tell much of the story.
Take the
Dow Jones Industrial Average as an example.
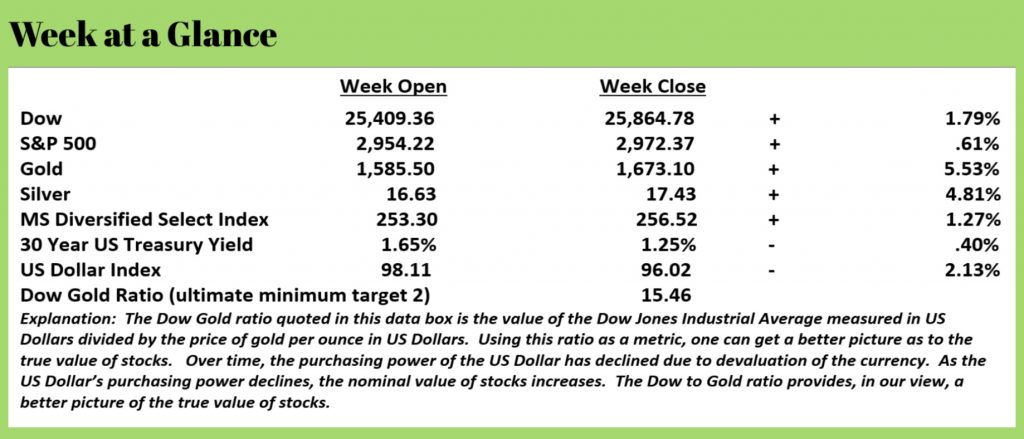
While it opened the week at 25,409.36 and closed the week at 25,864.78,
during the week it touched 27,051 and 25,302.
That’s a swing of about 7% within the confines of 5 trading days.
The stock
market volatility saw many investors moving for other assets. US Treasuries rallied monstrously. The 30-Year US Treasury’s yield now stands at
1.25%. Gold and silver also benefitted
from stock’s volatility. Gold rallied
5.53% and silver followed closely, gaining 4.81%.
The events
that we have been writing about for a long time may be coming to pass. As we have often stated, central bank easy
money policies lead to prosperity illusions that historically speaking, ALWAYS
end badly. Put another way, you can’t
print your way to prosperity.
We’ve long
predicted a Dow to Gold ratio of 2, but more likely 1. In December of last year, that ratio stood at
about 20, it is now approaching 15, that’s a move of 25% in a few, short
months.
For those
of you who are not familiar with the Dow to Gold ratio and why we use it, in
light of the volatility in the markets, we thought it would be helpful for all
of our readers if we explained.
The Dow to
Gold ratio is calculated by taking the value of the Dow Jones Industrial
Average in US Dollars and dividing that by the cost of gold per ounce in US
Dollars. As the markets closed last
Friday, the Dow stood at 25,864.78 and gold was selling for 1673.10 per ounce.
Here’s the
trouble with measuring things in US Dollars; their value isn’t constant. Over time, because of the easy money policies
referenced above, US Dollars lose purchasing power. As purchasing power is lost, costs and values
rise. At least they rise nominally
speaking.
For
example, on January 1, 2000 the Dow Jones Industrial Average stood at
16,717. Comparing that to the value of
the Dow today, one concludes that the Dow has increased about 55% over the last
20 years.
But that
increase is in NOMINAL terms, not real terms.
Since calendar year 2000, the US Dollar has lost a significant amount of
purchasing power. Let’s look at just a
couple of items.
In calendar
year 2000, a base model Ford Mustang Coupe retailed for $17,190. Today, 20 years later, it retails for
$26,670. That’s an increase of 55%.
How about
looking at the price of hamburger?
In calendar year 2020, according to the website beef2live.com, a pound of hamburger cost $1.48. Today, according to the Bureau of Labor Statistics, a pound of hamburger averages about $3.69. That’s an increase of 149%.
We would
argue that most of these increases are a result of the devaluation of the US
Dollar.
It’s this
devaluation of the currency that makes measuring economic output and stock
performance difficult. The reality is
that when it comes to stock performance, nominal returns don’t matter, it’s
real returns that you can feel in your pocketbook.
To make the
point, let’s take a look at gold prices over the same 20-year time frame. In calendar year 2000, gold prices stood at
$272 per ounce.
A Ford
Mustang could have been purchased with 63 ounces of gold. Today, the same base model coupe version of the
popular car could be obtained for about 16 ounces of gold.
In calendar
year 2000, an ounce of gold purchased about 184 pounds of hamburger. Today, that same ounce of gold buys 454
pounds of hamburger.
Since an
ounce of gold never changes (unlike US Dollars), it’s a better metric to use
when determining real prices.
What about
stocks?
There are
many sources that graph the Dow to Gold ratio.
In 2000, an investor could buy the entire Dow for about 40 ounces of
gold, while today it only takes 15 ounces.
Here’s the
very important point.
Measured in
terms of US Dollars, asset values and consumer prices have been rising. Measured in real terms, they have been
declining.
The same
point could be made about economic output typically measured by Gross Domestic Product.
In calendar
year 2000, the economic output of the United States as measured by Gross
Domestic Product was $10.3 trillion. In
2019, economic output was $21.4 trillion.
In nominal terms, that’s an increase of 107%. Impressive right?
Not so fast.
Let’s look
at it in real terms.
In 2000
economic output measured in ounces of gold was about 37.9 billion gold ounces.
Last year,
taking the low price of gold for the year of about $1270 per ounce, US economic
output measured in ounces of gold was 16.85 billion gold ounces.
Money creation creates prosperity illusions. And, lest some of you readers think this is a political rant, it’s not. We are using a 20-year time frame very intentionally.
In real
terms, we are in a deflationary environment.
In nominal terms we are in an inflationary environment. What that means is storing some of your
wealth in tangible assets has increased the purchasing power of that stored
wealth. Storing your wealth in paper
assets has seen purchasing power decline.
Given our
forecast for the Dow to Gold ratio to reach 2 or even 1, we expect this trend
to continue and intensify over the long term.
The Fed
will do what they can to fight back.
This past week, the Fed cut interest rates by .5%. The yield on the 30-Year US Treasury Bond now
stands at 1.25% an all-time low.
Can
interest rates go lower?
We think
so, although an increase in interest rates from these lows given last week’s
extreme price activity seems likely. If
you own long term US Treasuries, you might even consider taking some profits
here and buy a dip in bond prices moving ahead.
(Note: this can be confusing since bond prices and yields move in
opposite directions. When yields fall,
prices rise and vice versa.)
Before the
election later this year, we would not be surprised to see negative interest
rates on some US Treasury issues and perhaps even helicopter money from the
politicians.
Helicopter
money is money that is created and given directly to citizens rather than banks
as in the case with quantitative easing.
Helicopter money could come in the form of a tax cut that is advanced to
taxpayers.
While free
money might sound nice on the surface, it’s ultimately very destructive.
Should
these two events, helicopter money and negative interest rates, occur, you’ll
want to be tangible with more of your assets.
Gold, silver and some kinds of real estate may be attractive for many
investors moving ahead.
If you have
not yet adopted the ‘two bucket’ approach to managing money, we would urge you
to strongly consider. It’s our strong
conviction that using the traditional ‘one bucket’ approach used by “Wall
Street Only” financial professionals will fail many investors in the near
future.
We saw
first-hand the devastation it wrought with many aspiring retirees in 2007-2008
and before that in 2000-2002. When this
bubble bursts, it has the potential to be far worse.
This
week’s Retirement Lifestyle Advocates Radio Program is now posted at www.RetirementLifestyleAdvocates.com. This week host, Dennis Tubbergen chats with
Karl Deninger about stocks and money printing.
If you are not yet a client of Retirement Lifestyle Advocates and would like to learn more about using the two-bucket approach to managing your assets, consider attending a free, educational event. Details are posted at www.SocialSecurityDinner.com.
“If I cannot do great things, I can do small
things in a great way.”
-Dr. Martin Luther King