
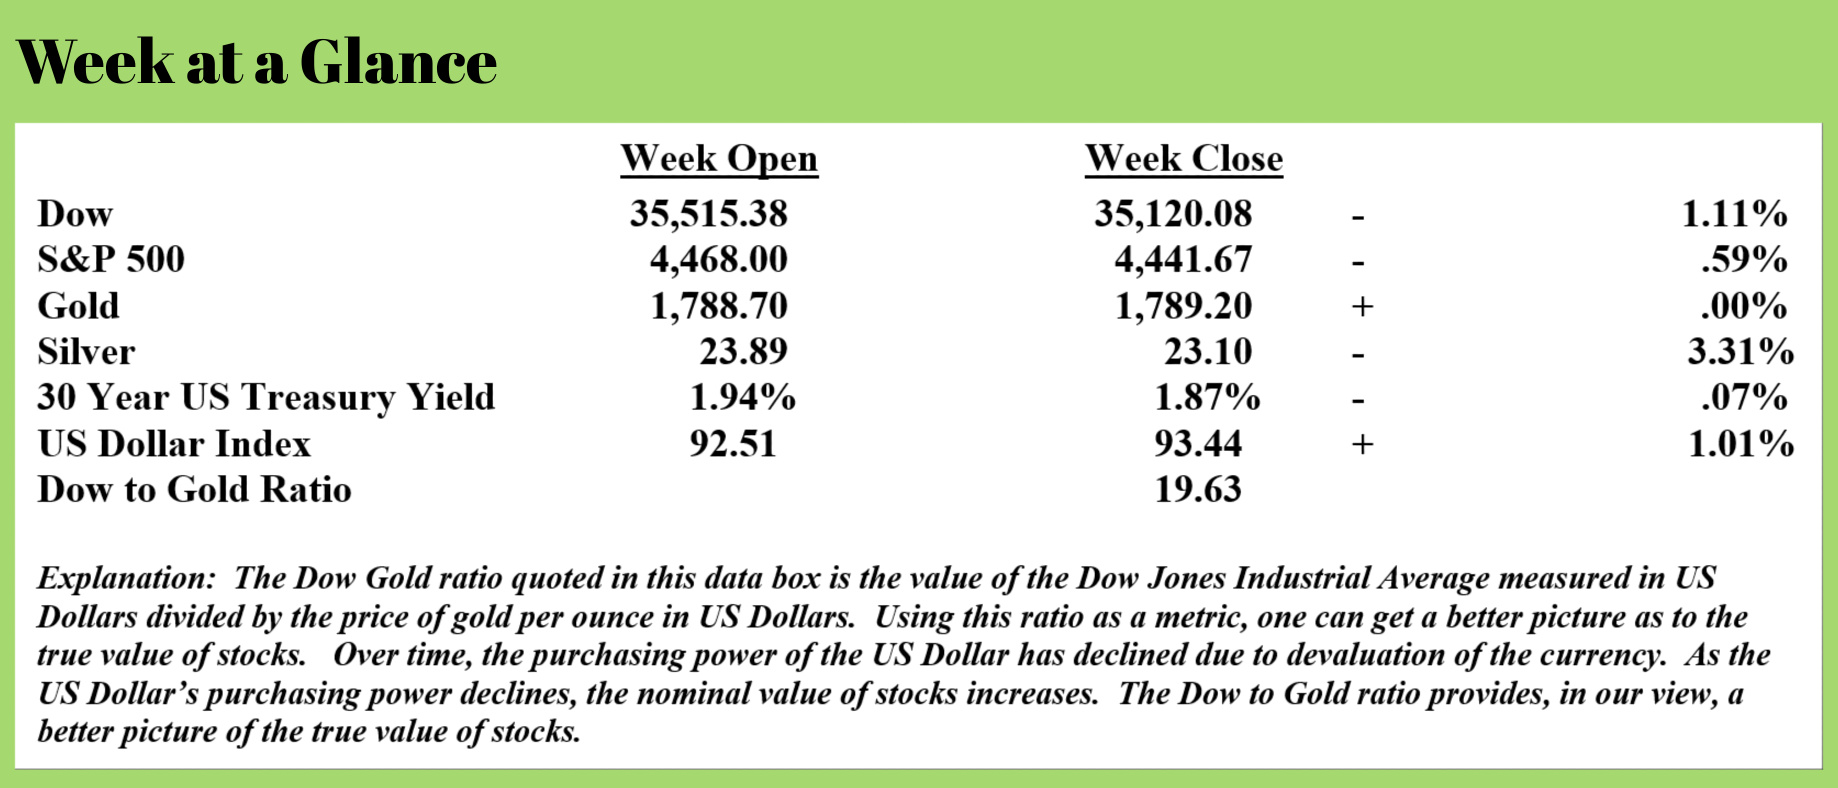
 Weekly Market Update by Retirement Lifestyle Advocates
For more than a couple of years, I have been of the opinion that stocks have been overvalued. Over that time frame, except for early 2020, stocks have continued to rise.
For the record, I don’t believe that this continued rise in stock prices invalidates my initial opinion about stock valuations; instead, it demonstrates how closely linked stock performance is with the easy money policies that have been pursued by the central bank of the United States, the Federal Reserve.
As overvalued as stocks were a few years ago, they are even more overvalued today; more so than at any time in history by many different measures.
A couple of months ago, I reported that our longer-term trend-following indicators seemed to have stock prices beginning to break down from a technical perspective. Now, there are other indicators that may be confirming that this is the case.
This past week, while doing the research that I do nearly every day, I read an article that succinctly and concisely described some of these indicators.
The Hindenburg Omen, an indicator that has appeared before nearly every historical stock market correction flashed a warning sign last week. (For clarity, a Hindenburg Omen appears before market corrections, but a market correction does not occur every time a Hindenburg Omen appears.)
For readers that are unfamiliar with the Hindenburg Omen, it is the name given to market conditions when a large number of stocks on the New York Stock Exchange are making new lows while a large number of stocks are making new highs.
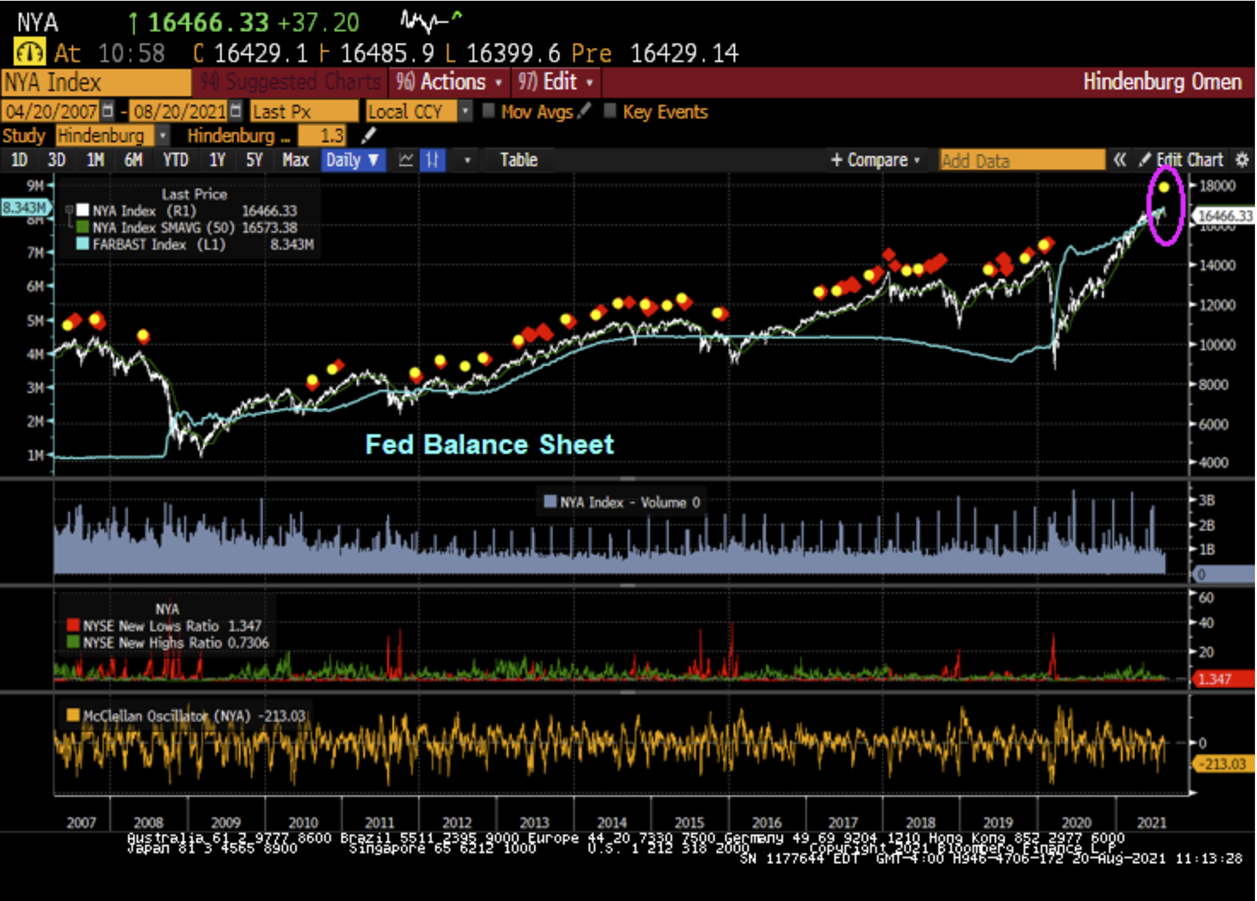 The chart reproduced here (right) shows the Federal Reserve’s balance sheet as well as Hindenburg Omens that have occurred historically. Notice that the last Hindenburg Omen emerged just prior to the stock market correction of early 2020.
If you look at the chart carefully, you’ll see a very strong correlation between the Fed’s balance sheet and the price movement of the S&P 500.
Notice also from the chart that multiple Hindenburg Omens appeared prior to the stock market correction of 2007 through early 2009.
The recent emergence of another Hindenburg Omen doesn’t mean that a stock market correction is imminent, but it does increase the probability of a correction.
The Shiller CAPE ratio is also sounding an alarm presently. If you are unfamiliar with this indicator, it is also known as the Cyclically Adjusted Price-Earnings ratio. It is defined as the S&P 500's current price divided by the 10-year moving average of inflation-adjusted earnings. It is used as a valuation metric to forecast future returns, where a higher CAPE ratio could reflect lower returns over the next couple of decades, whereas a lower CAPE ratio could reflect higher returns over the next couple of decades, as the ratio reverts to the mean.
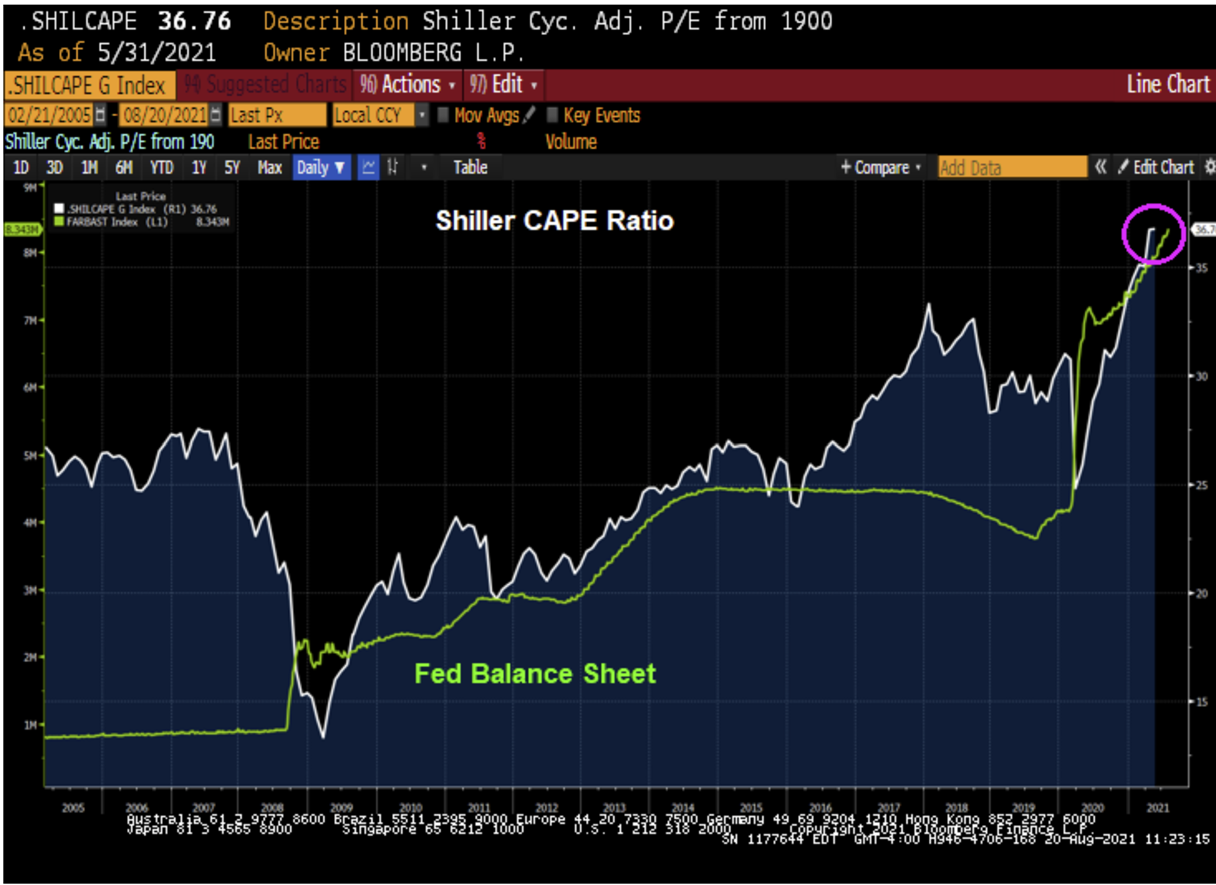 The chart republished here (left) shows the Shiller CAPE ratio with the Federal Reserve’s balance sheet.
The current level of the Shiller CAPE ratio is approaching 37, an all-time high. For comparison’s sake, the Shiller CAPE ratio stood at about 27 prior to the stock market decline beginning in 2007. Today’s Shiller CAPE ratio is nearly 40% higher than in 2007.
Again, an all-time high Shiller CAPE combined with a Hindenburg Omen is no assurance that a crash is coming, but again, the likelihood is higher.
As I have discussed in these pages frequently, Warren Buffet’s favorite stock market valuation measure is the market capitalization to gross domestic product ratio.
It is calculated by taking the total value of the stock market and dividing it by the total economic output of the United States.
It was this indicator that Mr. Buffet referenced in a 1999 speech during which he forecast that stock prices were likely to fall.
Mr. Buffet was 100% correct.
At the present time, the Buffet indicator shows stocks more overvalued than at any time in history.
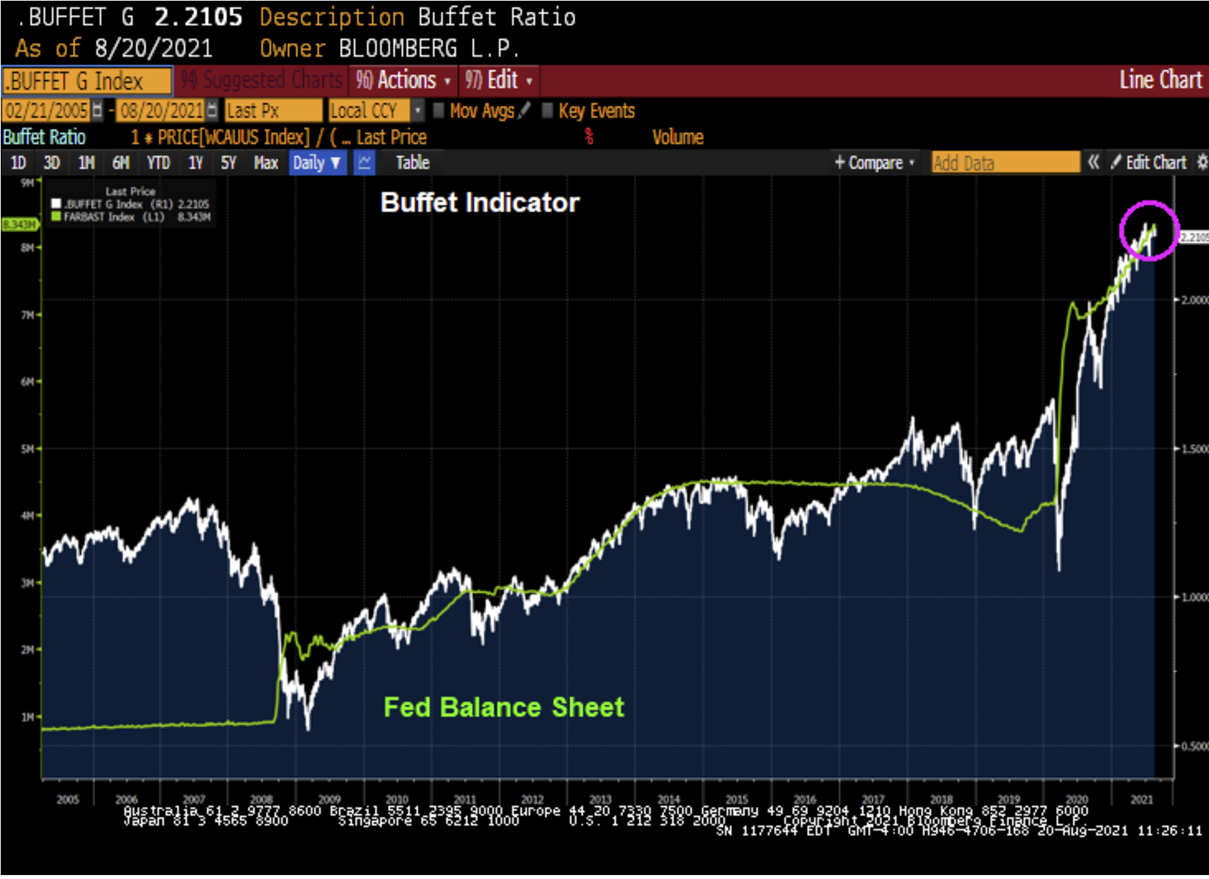 As you can see from the chart of the Buffet Indicator reproduced here (right), the ratio is now more than twice the indicator’s level prior to the market decline of 2007 and has far exceeded the levels it reached in 1999 when Mr. Buffet used it to forecast a decline in stocks.
Three indicators, all seemingly confirming that the probability of a stock market correction is high.
Interestingly, on all three of these charts, the common denominator is the currency created by the Federal Reserve.
It is this currency creation that has, in my view, propelled this bull market in stocks to levels that would never have been attained without currency creation.
This currency creation has created stock market conditions that are unsustainable.
Again, this doesn’t mean that a stock crash is imminent, but a crash is, in my opinion, inevitable once the currency creation slows.
There is one other chart that makes this point nicely.
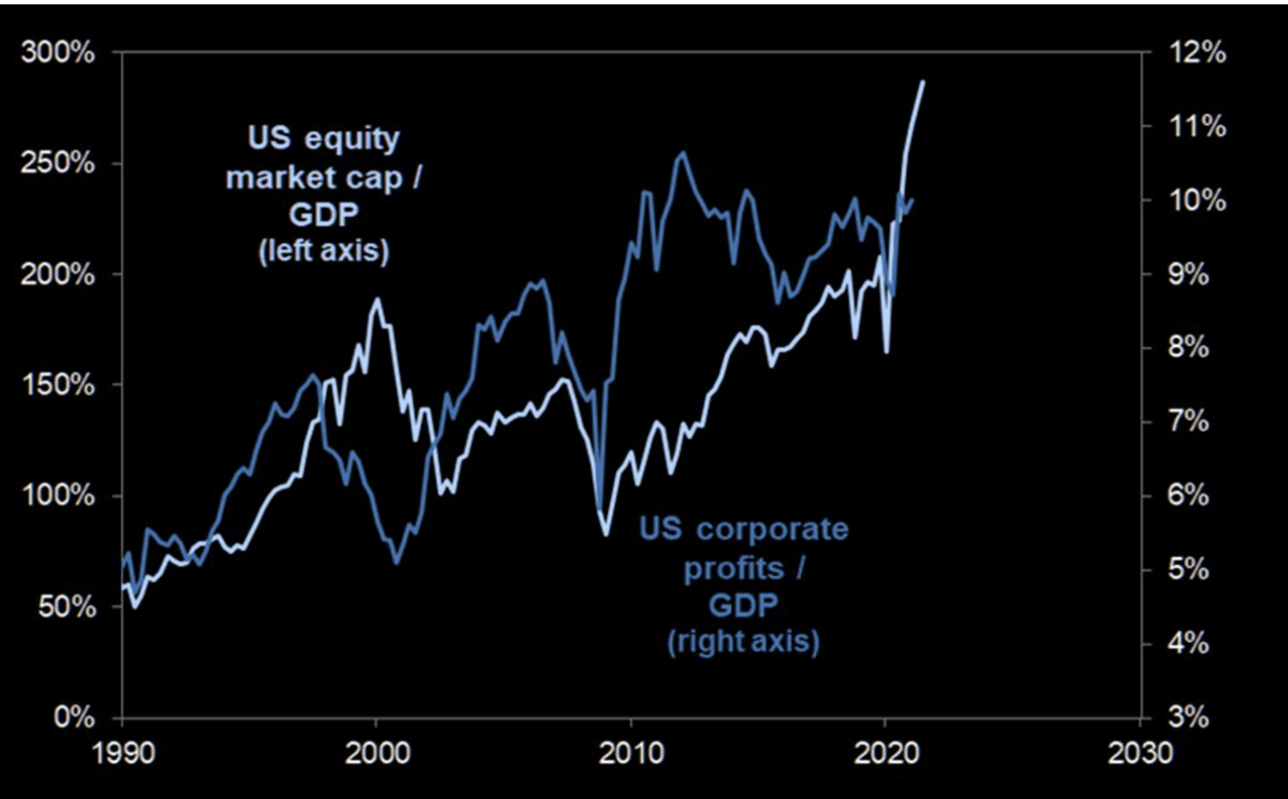 This chart here (left) illustrates the Buffet Indicator with the white line and corporate profits as a percentage of Gross Domestic Product with the blue line.
It’s instructive to note that there has been only one other time in the last 30+ years that stocks have been so overvalued relative to earnings; it was at the time the tech stock bubble began to unwind as stock prices crashed.
One look at the chart has one concluding that stock prices are FAR more overvalued today than at the time of the tech stock wreck.
As inflation rises with geo-political tensions, fasten your seatbelts; it’s likely going to get very interesting from this point on.
My new book “Retirement Roadmap” was released ten days ago and achieved #1 best-seller status on Amazon in eleven categories. Thank you for your support!
This week’s radio program is a best-of program featuring an interview with Karl Denninger with whom I discuss the infra-structure bill and some of the items hiding in the bill that may not be widely known.
You’ll want to catch this conversation by listening to the podcast now by clicking on the "Podcast" tab a the top of this page.
“I don’t think much of a man who is not wiser than he was yesterday.”
-Abraham Lincoln
