
 Weekly Update from RLA Tax and Wealth Advisory
By: Dennis Tubbergen
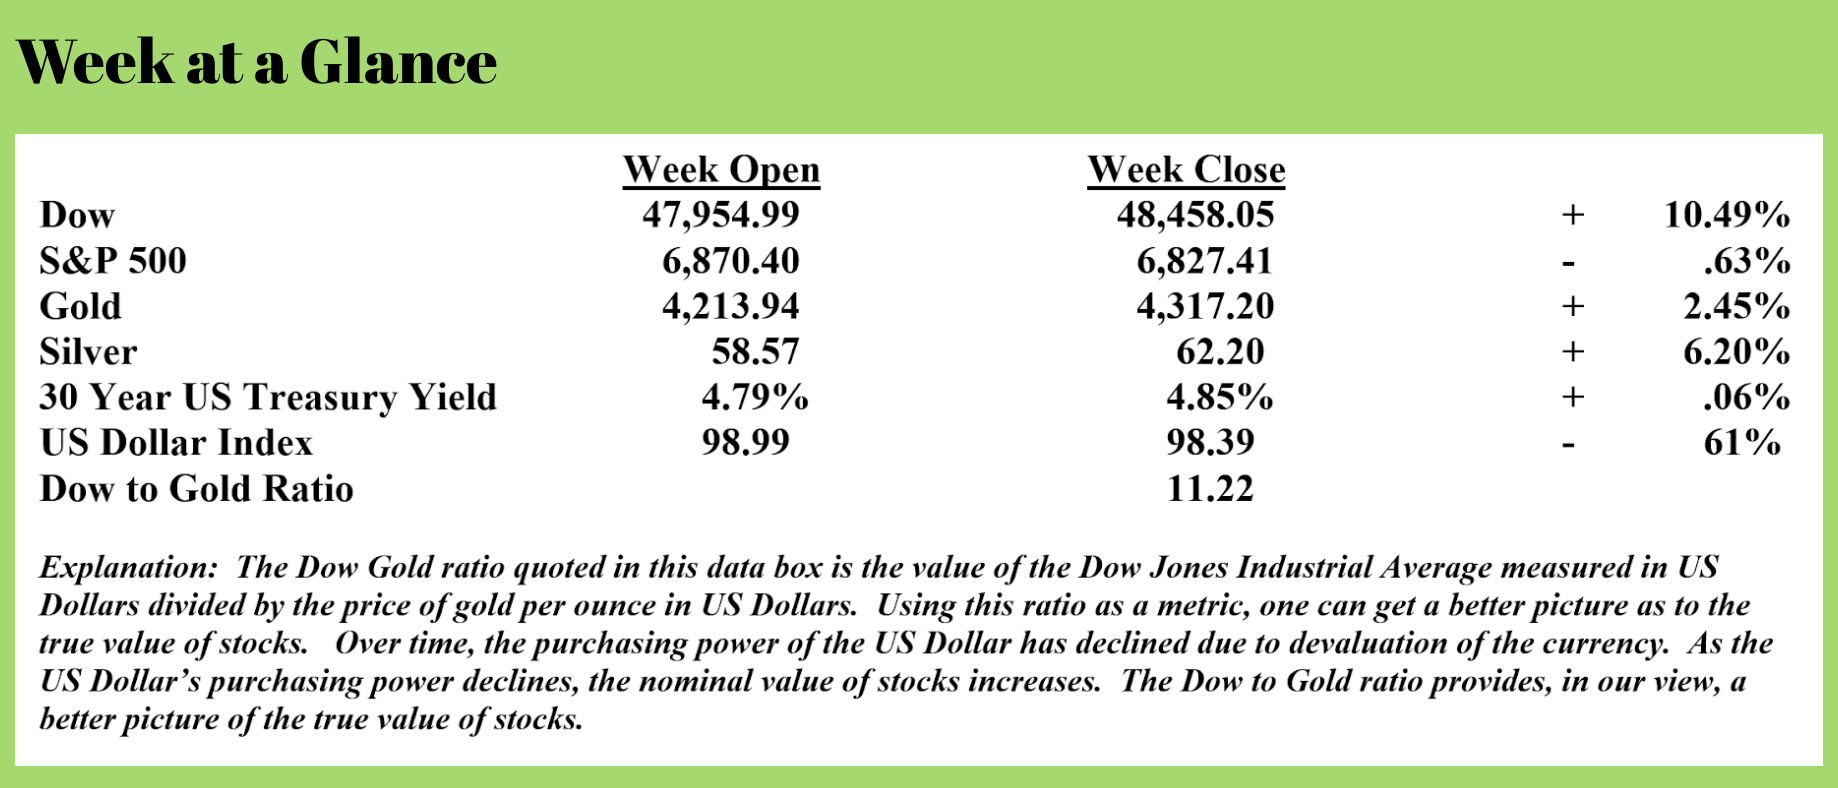
Dow to Gold Ratio Update
For many years, I have been discussing the relationship between the value of the Dow Jones Industrial Average and the price of gold per ounce in US Dollars. This relationship is often illustrated by plotting the Dow-to-gold ratio on a chart like this one.
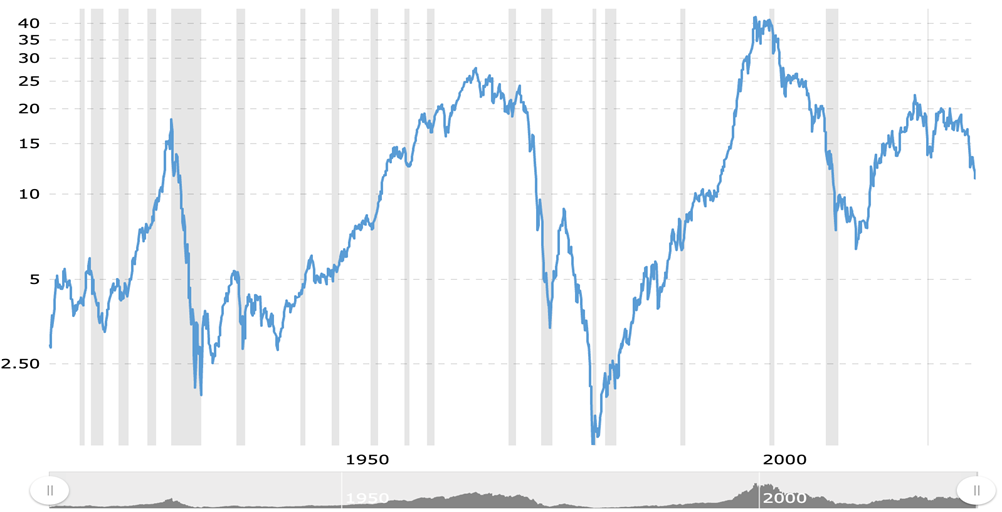
Notice that the Dow to Gold ratio was about two at the stock market bottom at the time of the Great Depression. It then fell to about 1 in 1980 when the Dow stood at about 800, and the price of gold per ounce in US Dollars was about $800.
At the other extreme, at the stock market peak in 1929, the Dow-to-Gold ratio was about 17. At the stock market top in 1966, the Dow to Gold ratio was approximately 28. At the tech stock bubble peak at the turn of the century, the Dow to Gold ratio exceeded 40. It now stands at just over 11. I have long forecast that we would see this ratio reach 1 or 2 once again, or perhaps see the price of gold per ounce exceed the value of the Dow. Current developments are, in my view, confirming this forecast. While this may sound extreme, consider that just seven years ago, the Dow to gold ratio was about twice the current level.
Rickards on Gold
Past RLA Radio guest and economic consultant, Jim Rickards, commented on the gold market last week. (Source: https://investorsdaily.co.uk/gold-commodities/8-events-driving-the-gold-frenzy/)
Rickards notes that gold is in its third bull market, with the first occurring from 1971 to 1980 and the second from 1991 to 2011. There were no bull markets prior to 1971 because gold was, in one way or another, tied to the US Dollar. Prior to 1913, the US Dollar WAS gold.
The first gold bull market saw the price of gold in US Dollars increase by 2200% while the second saw gold prices rise nearly 700%.
Depending on when one calculates the current bull market began, current gains in gold are either 300% (calculating from 2015’s price low) or 110% (calculating from the breakout over $2,000 per ounce from 2023). Rickards suggests that if we average the gains of the prior two bull markets at 1400% and use that arbitrary number to project the possible gains in this gold bull market, we could see gold reach $28,000 per ounce by 2033.
Should the 1971 to 1980 period replay, gold could be closer to $100,000 per ounce. Given the price action of gold over the past two bull markets, it is reasonable to project $10,000 per ounce gold in the relatively near future (a couple of years?) and perhaps see prices go much higher.
Rickards notes that there are some strong, underlying fundamentals that may drive gold prices much higher,
Central banks remain net buyers of gold. Gold is now the number one reserve asset of global central banks.
Mining output has been flat for six years. Increased demand and static supply will mean higher prices.
The copper-to-gold ratio is at an all-time low, favoring higher gold prices moving ahead.
Russia has nicely survived the sanctions placed on the country by maintaining 25% of its reserves in gold. Now, the rest of the BRICS countries are following suit.
Gold-backed cryptos are creating new demand for gold. Tether has a digital token XAUt that has a market capitalization of more than $2 trillion. Tether now holds more than 16 metric tons of gold to back the token, which means that there are 16 tons of gold that are effectively off the market.
There is a dispute in Italy over whether the 2500+ tons of gold there are owned by the people or the central bank. This demonstrates a global demand for physical gold ownership.
More gold companies are cropping up, including one founded by news personality Tucker Carlson.
There is ongoing speculation as to whether the US will revalue its gold holdings to the current spot or market price of gold. This gold is currently carried at a statutory value of $42.22 per ounce.
Are We Close to a Government Debt Financing Problem?
I have been stating for a very long time that the day is coming when the Federal Reserve will have to become the buyer of last resort of US Government debt. That day is getting closer, and when it arrives, the outcome will be stagflation, perhaps severe stagflation. That will mean high consumer price inflation combined with a contracting economy. That day is getting closer. In 2026, the US Government will need to refinance 1/3rd of the government’s outstanding debt – that’s about $13 trillion plus the additional deficit spending that will need to be refinanced. (Source: https://realinvestmentadvice.com/resources/blog/a-third-of-us-debt-matures-in-2026/)
The problem with that is the US Government can’t sell long-term debt instruments. Seems that the rest of the world isn’t too excited about loaning the US Government money for a long period of time. The just-completed US Government bond auction from last week saw the US Government sell $602 billion in debt, with more than 80% of this debt financed for 26 weeks or less. (Source: https://wolfstreet.com/2025/12/12/us-government-sold-602-billion-of-treasuries-this-week-10-year-treasury-yield-bounces-back-to-4-20-30-year-yield-to-4-86-highest-since-sep-4-after-fed-cuts/) The debt financing and refinancing requirements of the US Government are going to get very interesting next year.
RLA Radio
The RLA radio program this week features an interview that I did with technical analyst Michael Oliver. The program is available by clicking the "Podcast" tab at the top of this page or via any podcast distribution source.
Quote of the Week
“The less their ability, the more their conceit.” - Ahad Ha'am

Comments