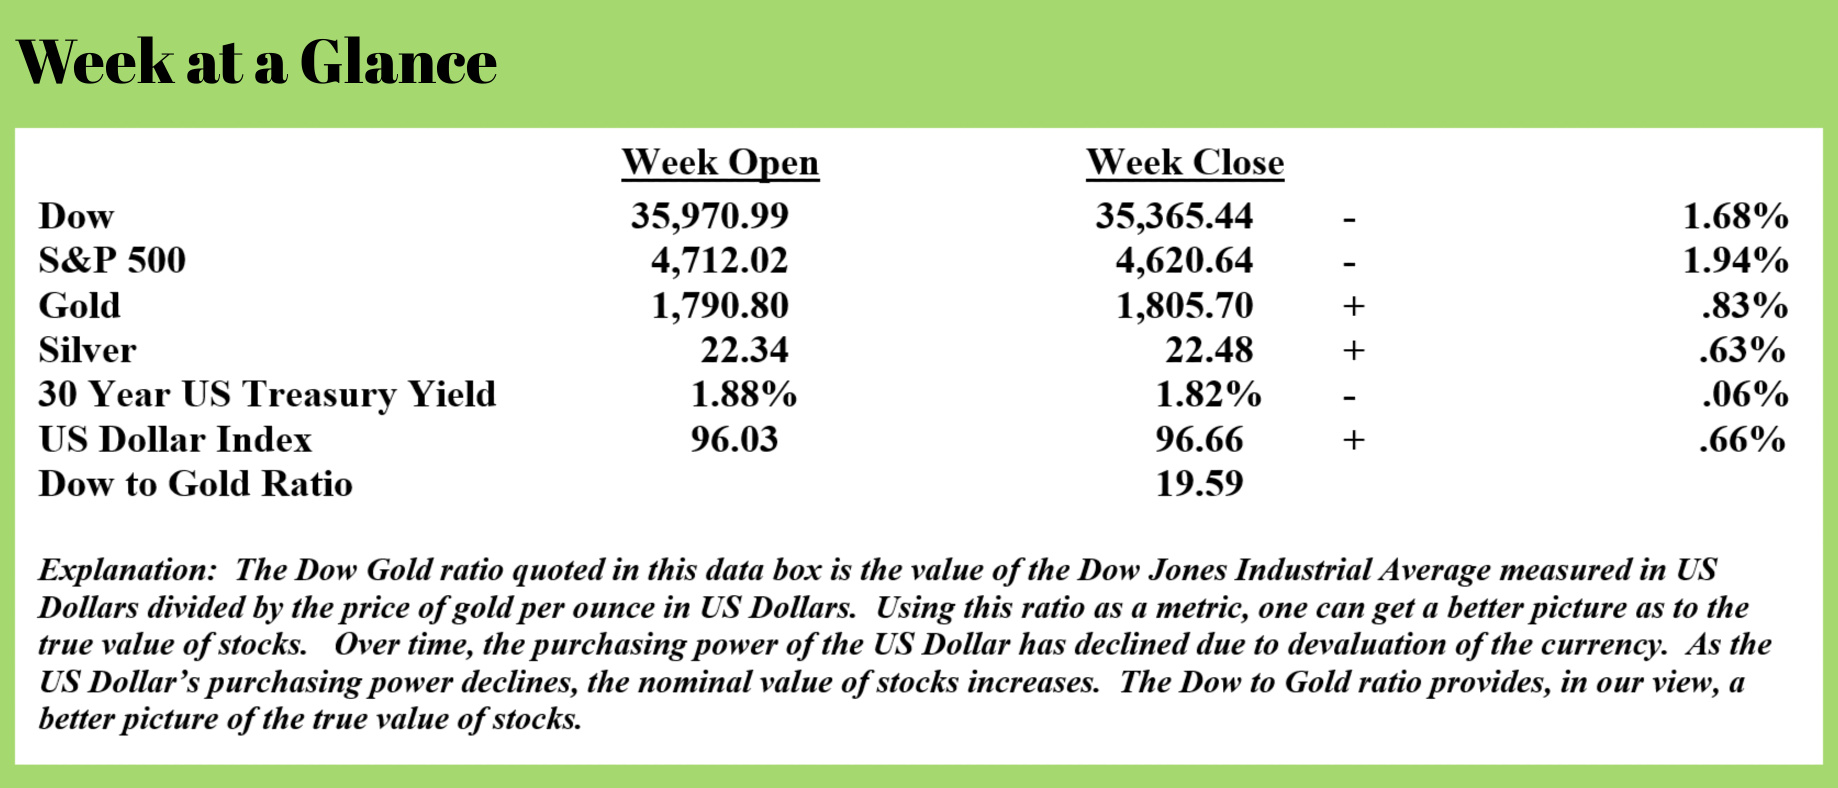
 Weekly Market Update by Retirement Lifestyle Advocates

The stock market highs of November have not yet been taken out and my long-term trend-following indicators continue to become more bearish. At this point, a “Santa” rally looks less likely especially given the Fed’s recent statements about accelerating the taper or slowing the rate of currency creation.
As the longer-term readers of “Portfolio Watch” are aware, I believe the Fed’s taper talk is just that. The math doesn’t lie; the federal government cannot fund its deficit spending without currency creation. While the Fed may taper officially, liquidity will have to be made available in order to close the budget gap.
Of course, common sense dictates that this process of currency creation will have to cease at some future point. When it does, it is my belief that a reset will have to occur that will affect many assets including stocks and real estate.
Both stocks and real estate are in a bubble in my view.
David Stockman, former budget director, penned an article last week that examines just how extended stocks likely are. Here is a bit from Mr. Stockman’s piece (Source: https://internationalman.com/articles/david-stockman-reveals-the-truth-about-the-stock-market-and-what-it-means-for-you/)
The fundamental consequence of 30 years of Fed-fueled financial asset inflation is that the prices of stocks and bonds have way overshot the mark.
That’s why what lies ahead is a long stretch of losses and investor disappointment as the fat years give way to the lean.
These will hit hard the bullish investor herd and aggressive buyers of calls who can’t imagine any other state of play. They will be shocked to learn — but only after it is way too late — that the only money to be made during the decades ahead is on the short side of the market by buying puts on any of the big averages: the FANGMAN, S&P 500, NASDAQ 100, the DOW and any number of broad-based ETFs.
The reason is straightforward. The sluggish, debt-ridden Main Street economy has been over-capitalized, and it will take years for company profits and incomes being generated to catch up to currently bloated asset values. Accordingly, even as operating profits struggle to grow, valuation multiples will contract for years to come, owing to steadily rising and normalizing interest rates.
We can benchmark this impending grand reversal on Wall Street by reaching back to a cycle that began in mid-1987. That’s when Alan Greenspan took the helm at the Fed and promptly inaugurated the present era of financial repression and stock market coddling that he was pleased to call the “wealth effects” policy.
At the time, the trailing P/E multiple on the S&P 500 was about 12X earnings — a valuation level that reflected a Main Street economy and Wall Street financial markets that were each reasonably healthy.
The US GDP in Q2 1987 stood at $4.8 trillion and the total stock market was valued at $3.0 trillion, as measured by the Wilshire 5000. Back then, Wall Street stocks were stably capitalized at 62% of Main Street GDP.
Over the next 34 years, a vast unsustainable gulf opened up between the Main Street economy and the Wall Street capitalization of publicly traded stocks.
During that three-decade period, the Wilshire 5000 market cap rose by 1,440% to $46.3 trillion. That’s nearly four times the 375% gain in nominal GDP to $22.7 trillion.
Accordingly, the stock market, which was barely three-fifths of GDP on Greenspan’s arrival at the Fed, now stands at an off-the-charts 204% of GDP.
If we assume for the moment that the 1987 stock market capitalization rate against national income (GDP) was roughly correct, that would mean that the Wilshire 5000 should be worth $14 trillion today, not $46 trillion. Hence, the $32 trillion of excess stock market valuation hangs over the financial system like a Sword of Damocles.
In fact, we believe that the gulf between GDP and market cap has been growing wider and more dangerous since the Fed sped up money printing after the Lehman meltdown. To wit, since the pre-crisis peak in October 2007, the market cap of the Wilshire 5000 is up by nearly $32 trillion, while the national income to support it (GDP) is higher by only $8 trillion.
The stock market’s capitalization should be falling, not soaring into the nose-bleed section of history. After all, since the financial crisis and Great Recession, the capacity of the US economy to generate growth and rising profits has been sharply diminished. The real GDP growth rate since the pre-crisis peak in Q4 2007, for instance, is just 1.5% per annum, which is less than half its historical trend rate of growth.
Back in October 2007, the stock market’s capitalization was 106% of GDP and in just 14 years it has soared to the aforementioned 204%. So even as the growth rate of the US economy has been cut in half, stock market capitalization has doubled.
Given that the stock market has gotten way, way ahead of the economy, the longer-range implication is a long spell during which financial asset prices will stagnate or even fall until they eventually recover the healthy relationship to national income.
Looking at this from a different angle, the current $46 trillion market cap of the Wilshire 5000 would not return to 62% of GDP until US GDP reaches $75 trillion. At an average of 3.3% per annum increase in nominal GDP since Q4 2007, it would take 38 years to get there!
That’s right. The massively over-valued stock market is currently capitalizing on an economy that might exist by the year 2060… if all goes well.
Mr. Stockman offers a terrific perspective on where stock valuations have moved since the Fed began the ‘temporary’ policy of currency creation.
Real estate has followed a course similar to the course tracked by stocks.
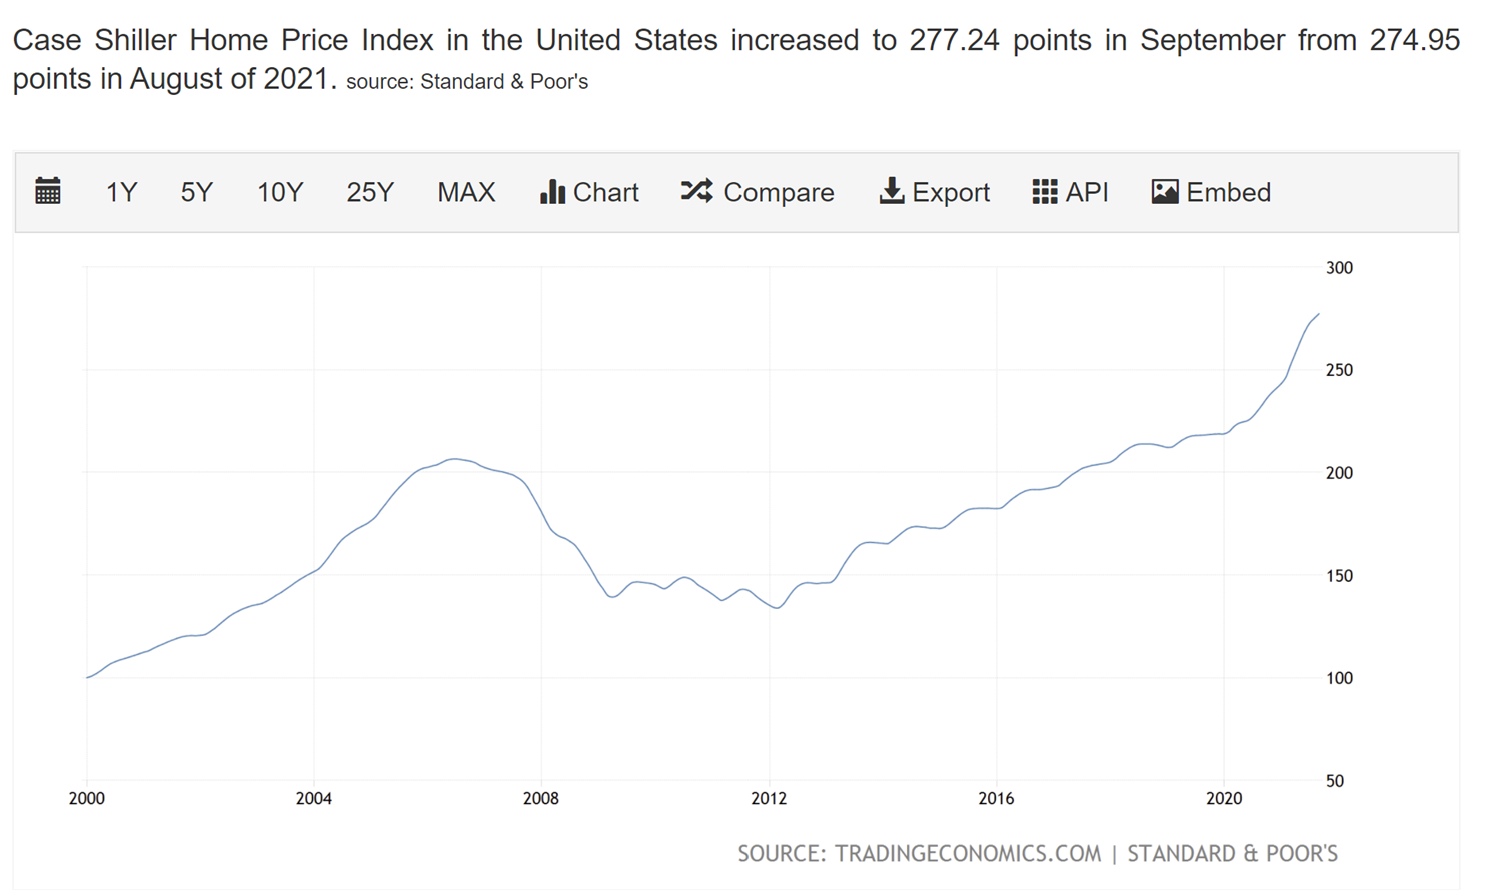
The Case-Shiller Housing Index is the commonly used metric of housing values. The chart illustrates housing values for the past 25 years.
 Looking at the chart, one can see the decline in housing values at the time of the financial crisis. The index fell from 200 to about 150.
Notice that housing values began to increase in earnest after the Fed began quantitative easing. Since that time, housing prices have nearly doubled.
And, as inflated as housing prices were at the time of the financial crisis, they are far more inflated presently – they are about 50% higher than they were prior to the collapse that began in 2007.
Of course, as we have demonstrated many times in the past if real estate and stocks were priced in gold rather than depreciating US Dollars, one gets a completely different perspective. In 2007, gold was about $650 per ounce. Today, the spot price of gold is about $1800. That’s an increase of about 275%. Priced in gold, both stocks and real estate have declined in value which one would expect given the massive levels of debt that exist.
The reality is that the US Dollar and every other fiat currency around the world is no longer an accurate metric when examining economic data and asset pricing.
This week’s radio program features an interview with Michael Pento, host of the Midweek Reality Check Podcast.
I talk to Michael about inflation and how it ends. We have an insightful conversation about the inflation-deflation cycles that are now quite predictable as a result of Federal Reserve policy. Listen to the show now by clicking on the "Podcast" tab at the top of this page.
“It was self-serving politicians who convinced recent generations of Americans that we could all stand in a circle with our hands in each other’s pockets and somehow get rich.”
-Paul Harvey


