
 Weekly Market Update by Retirement Lifestyle Advocates
Before I get into this week’s topic, one observation: the financial markets are now as inverse as I’ve ever seen them. And I’ve been a market observer and analyst for many years.
The fundamentals of the stock market are not favorable. The “Buffet Indicator”, used to value stocks, tells us that stocks are more overvalued than at any time in the past, including the tech stock bubble peak.
Yet, the technicals surrounding the stock market are still telling us that stocks are in an uptrend, although the uptrend is looking extremely stale. One of my favorite technical measures tells me that stocks are now more overbought than they were oversold at the market bottom of early 2009 after the financial crisis.
Let’s just say by my measure, stocks are extremely overbought and a correction at any point would not be surprising.
Now for the inverse part.
Today’s monetary policies of massive money creation to fund record deficits are good for gold, silver, and other tangible assets from a fundamental perspective. Yet, from a technical perspective, I have gold in a short-term downtrend.
Eventually, the technicals will have to catch up with the fundamentals.
I’d still suggest accumulating precious metals over the longer term and protecting open stock positions with sell-stop losses to protect profits.
Recently though, stocks, residential real estate, and crypto-currencies continue to perform exceptionally well.
Although when looking at the price data, you don’t need to be a brilliant market analyst to quickly conclude that the current trends are most probably totally unsustainable.
As I noted above, a severe decline in the value of all these assets soon seems to be the most likely outcome. Let’s begin by looking at residential real estate in January.
According to Redfin (Source: https://www.prnewswire.com/news-releases/housing-market-stayed-hot-in-january-as-home-prices-rose-14-and-sales-surged-20-301231610.html) house prices rose 14% in January year-over-year and sales surged 20% from one year prior. Higher prices are driven largely by lower interest rates.
Interest rates are rising although they remain at attractive levels. The average interest rate on a 30-year mortgage has risen but remains under 3%.
 Stocks are also performing as if they may be approaching a blow-off top. During the month of February, the energy stock index is up more than 17%, financials are up more than 11% and industrials are up more than 7%.
Big price moves like these are often followed by big price declines as over the long term, prices tend to revert to the mean.
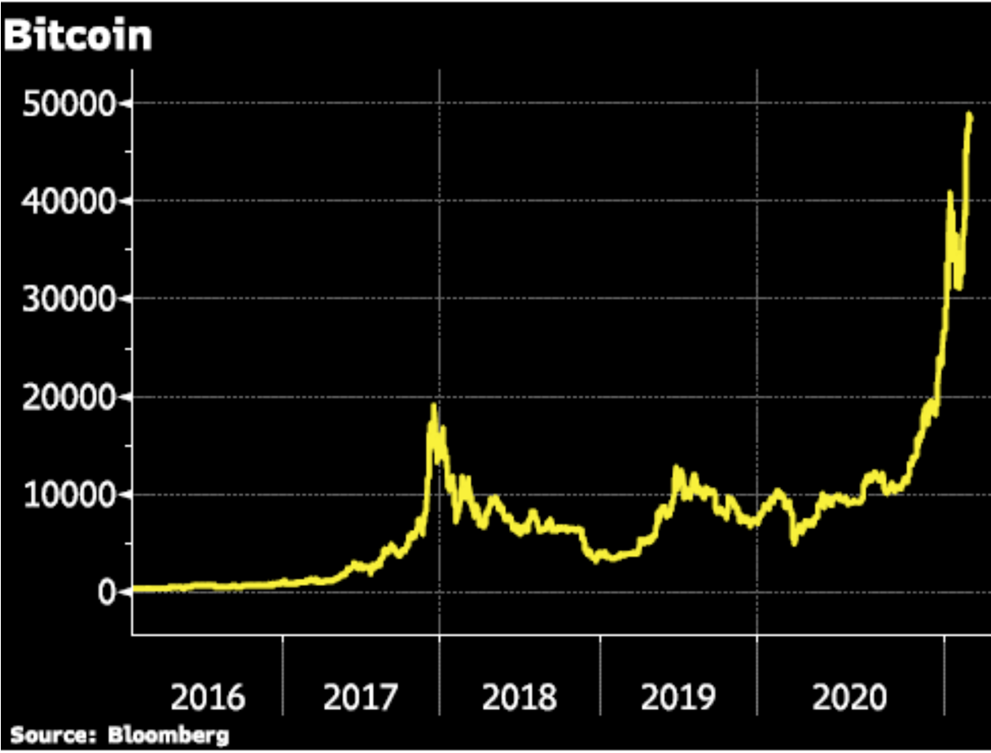
Bitcoin recently exceeded $52,000 and is up more than 300% since August. The Bitcoin price chart on this page tells the story.
While there are those who believe that Bitcoin will be the currency that replaces the world’s failing fiat currencies, I am not among them.
My take is that the Bitcoin price chart looks a lot like the tulip price chart of the 1600’s.
Notice that from November 12, 1636 to February 3, 1637, the price of tulip bulbs increased about 12-fold before crashing and returning back to their original price.
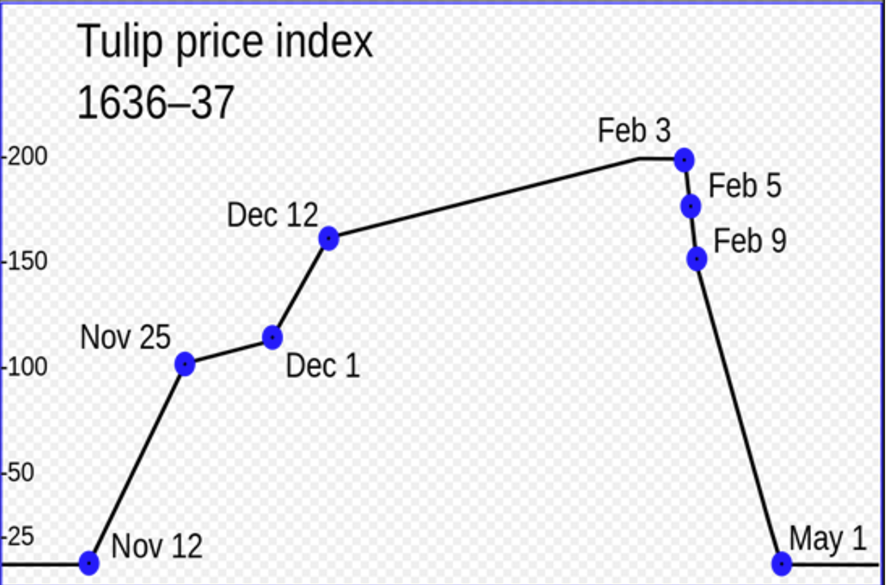 It is my belief that Bitcoin will likely do something similar. That doesn’t mean that Bitcoin cannot go higher – it can.
It also doesn’t mean that investors can’t make money speculating on the price of Bitcoin – they can.
Ultimately though, it’s highly unlikely in my view that Bitcoin becomes the currency of choice. Currencies need to be stable to be widely accepted as currency. One scan of the Bitcoin price chart above would have anyone concluding that stability doesn’t begin to describe Bitcoin.
For a long time now, in print and on the radio program, I have been talking about the fact that there will have to be a reset at some future point. Both debt levels and currency creation are unsustainable.
Historically, when debt levels reach the heights that we now see, deflation has emerged as debt is purged from the system and asset prices collapse. The price levels of the assets that we have briefly reviewed this week are at levels that a price decline would have already occurred.
But this price decline hasn’t occurred.
For one big reason – money creation has also reached new levels. Last year alone, the quantity of fiat currency in circulation increased by more than 30%. When money is created, it has to go somewhere and in this case, this newly created money has found its way to the asset classes we’ve discussed.
It seems that money creation on steroids has evolved from a ‘temporary’ measure that began after the financial crisis to a permanent policy that will now continue until a reactive reset hits.
While a proactively planned reset that would tie our currency to a tangible asset would be the preferred path in my view, such a course would require fiscal discipline at the Federal Government level and owning up to the fact that Federal programs would have to be adapted to be fiscally sound.
Instead, so-called stimulus packages, laden with pork, continue to ship massive amounts of newly created US Dollars overseas. The latest stimulus package that looks imminent would add $1.9 trillion to an existing $2.3 trillion federal operating deficit for a revised deficit of $4.2 trillion remarkably dwarfing last year’s deficit.
But it isn’t likely to stop there. “The Washington Post” reported this past week (Source: https://www.msn.com/en-us/news/politics/will-more-stimulus-follow-democrats-2419-trillion-relief-bill/ar-BB1dOvl9) that negotiations have already begun on a $3 trillion spending package that would come on the heels of the $1.9 trillion spending package.
Assuming that actually happens, the United States could see an operating deficit of more than $7 trillion on total Gross Domestic Product or economic output of less than $21 trillion in 2020.
Again, a PhD in economics is not required to quickly conclude that an operating deficit of more than 30% of GDP funded by money creation is a recipe for inflation on a massive scale. A quick review of historic hyperinflations and government operating deficits when the hyperinflations began confirms this.
Argentina’s inflation rate peaked in 1989 at an annualized rate of 4,923.3%. (Source: http://www.rtaland.com/news/hyperinflation-21-countries-in-25-years)
The Government of Argentina saw its operating deficit reached 35.6% of GDP that same year, a number that was alarmingly similar to the US’ operating deficit this year should the second spending package become reality.
There are other historical examples to make the point but suffice it to say that we are on a slippery slope as far as debt and money creation is concerned.
While it’s entirely possible that this profligate money creation continues for a period of time, history teaches us that the ultimate destination at which we will arrive as a result of this policy is known.
Inflation followed by deflation is now an almost certain outcome. And the time to prepare is now. As noted above, continuing to accumulate precious metals during this pullback in price is something to very seriously consider in my view.
If you’d like to get more information on owning hard assets, give the office a call and we can schedule a time to get you more information and educate you on the different ways to own hard assets,
Thank you all for your continued support and referrals. If you know of someone who could benefit from our educational materials, please have them visit our website at www.RetirementLifestyleAdvocates.com or download the YourRLA app for free at the app store. Our webinars, podcasts, and newsletters are available on the website and on the app.
The radio program this week features an interview with money manager Michael Pento. We get his take on rising interest rates and how the stock market might be affected.
That interview is now available on the website and on the app.
“Only two things are infinite, the universe and human stupidity, and I’m not sure about the former.”
-Albert Einstein
