
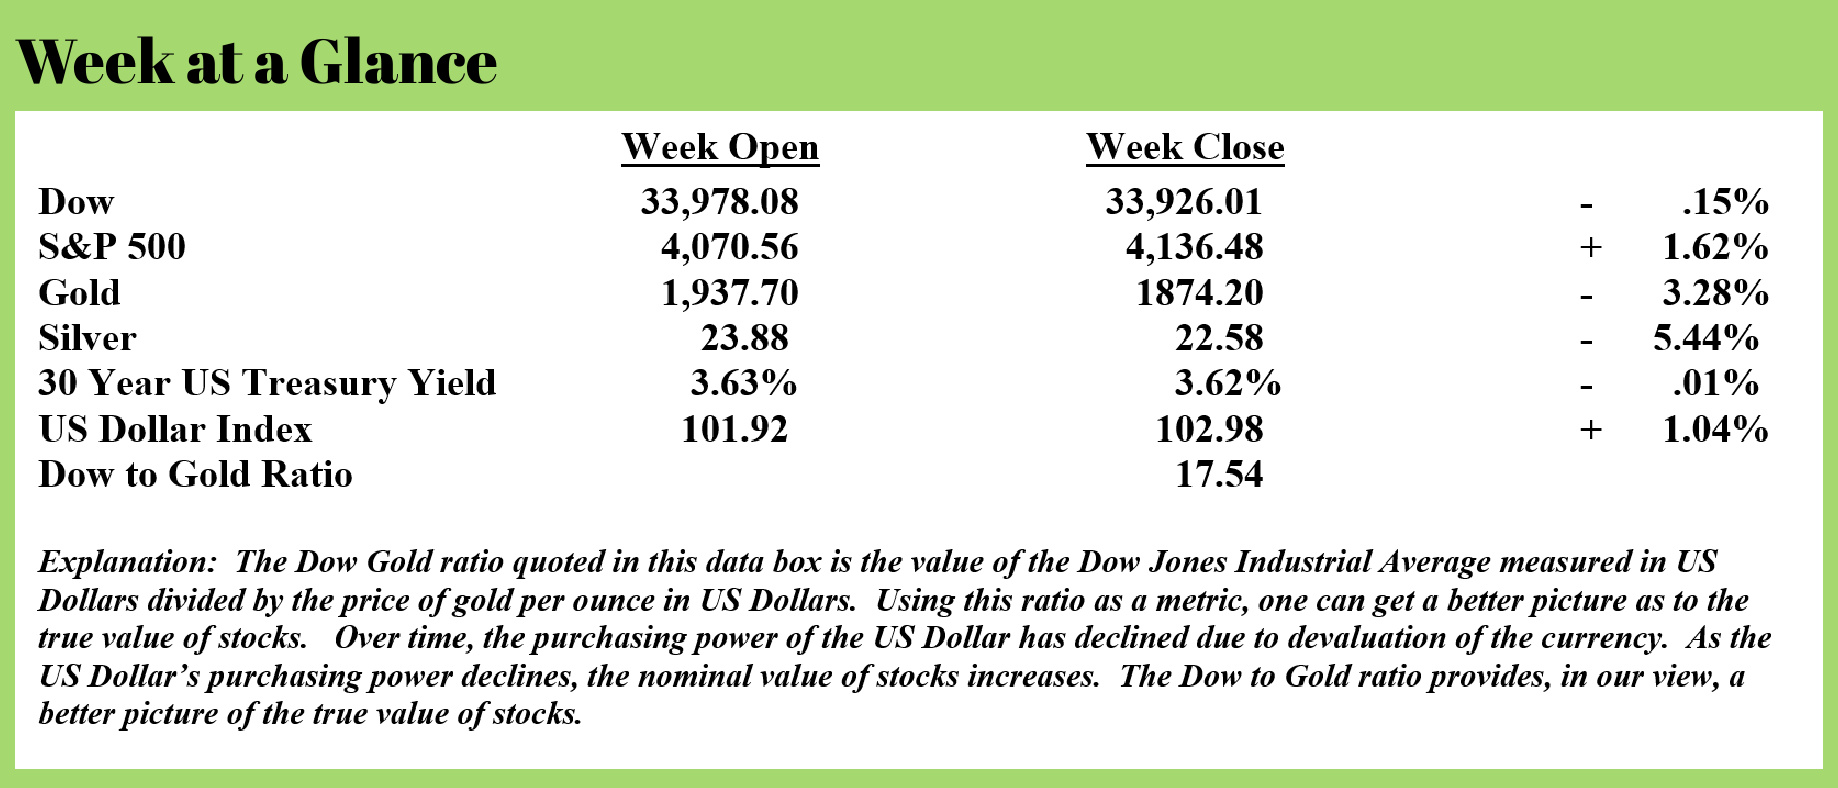
 Weekly Market Update by Retirement Lifestyle Advocates
Ever since the time of the Great Financial Crisis, I have written about the topic of bubbles.
Whether the bubble is a price bubble in stocks, bonds, real estate, or commodities, there are some ‘bubble characteristics’ that often hold true.
The first characteristic is that bubbles are often symmetrical, taking as long to unwind as they do to build.
The second bubble characteristic is that when a price bubble is graphed, the downside of the bubble is nearly a mirror image of the upside of the bubble.
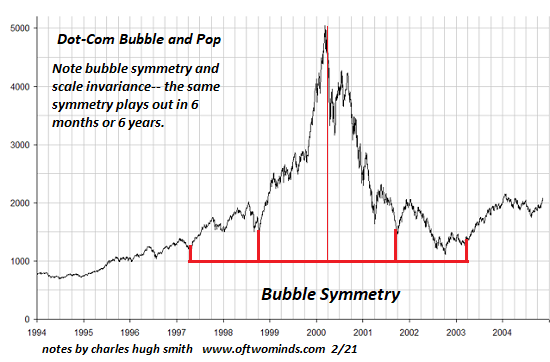
Charles Hugh Smith wrote a piece on this topic last week that, in my view, does a nice job explaining these bubble characteristics. (Source: https://www.oftwominds.com/blogjan23/bubble-symmetry1-23.html) Here is an excerpt from his excellent piece:
Should bubble symmetry play out in the S&P 500, we can anticipate a steep 45% drop to pre-bubble levels, followed by another leg down as the speculative frenzy is slowly extinguished.
Bubble symmetry is, well, interesting. The dot-com stock market bubble circa 1995-2003 offers a classic example of bubble symmetry, though there are many others as well. The key feature of bubble symmetry is the entire bubble retraces in roughly the same time frame as it took to soar to absurd heights.
Nobody could see bubble symmetry coming, of course. At the peak and for some time after, bubbles are viewed as the natural order of markets and so they should continue expanding forever.
Alas, the natural order of markets is mean reversion and the collapse of whatever is unsustainable. This includes speculative manias, credit bubbles, asset bubbles and projections of endless expansion of margins, profits, sales, consumption, tax revenues and everything else under the sun.
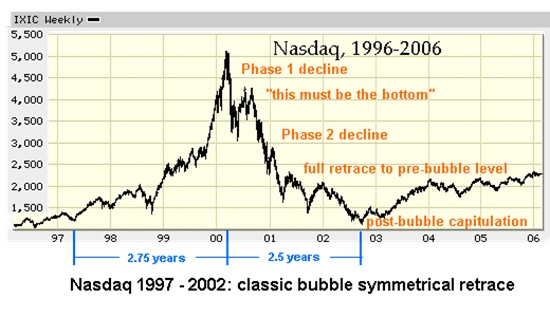
There's a well-worn psychological path in the collapse of bubbles. This path more or less tracks the Kubler-Ross phases of denial, anger, bargaining, depression and acceptance, though the momentum of speculative frenzy demands extended displays of hubris and over-confidence, i.e. the first wobble "must be the bottom."
There's also repeated spikes of false hope that "the bottom is in" and the bubble is starting to reflate.
This pattern repeats until the speculative fever finally breaks and all those betting on a resumption of the bubble mania finally give up.
This process often takes about the same length of time that it took for the bubble mania to become ubiquitous. If it took about 2.5 years for the bubble to expand, it takes about 2.5 years for the bubble to pop and the market to return to its pre-bubble level.
Once again we hear reasonable-sounding claims being used to support predictions of a never-ending rise in stock valuations.
What hasn't changed is humans are still running Wetware 1.0, which has default settings for extremes of emotion, particularly manic euphoria, running with the herd (a.k.a. FOMO, fear of missing out), and panic/fear.
Despite all the assurances to the contrary, all bubbles pop because they are based in human emotions. We attempt to rationalize them by invoking the real world, but the reality is speculative manias are manifestations of human emotions and the feedback of running in a herd of social animals.
As I was reading Mr. Smith’s analysis, I thought I would graph stocks using a chart of an exchange-traded fund that tracks the price of the Standard and Poor’s 500:
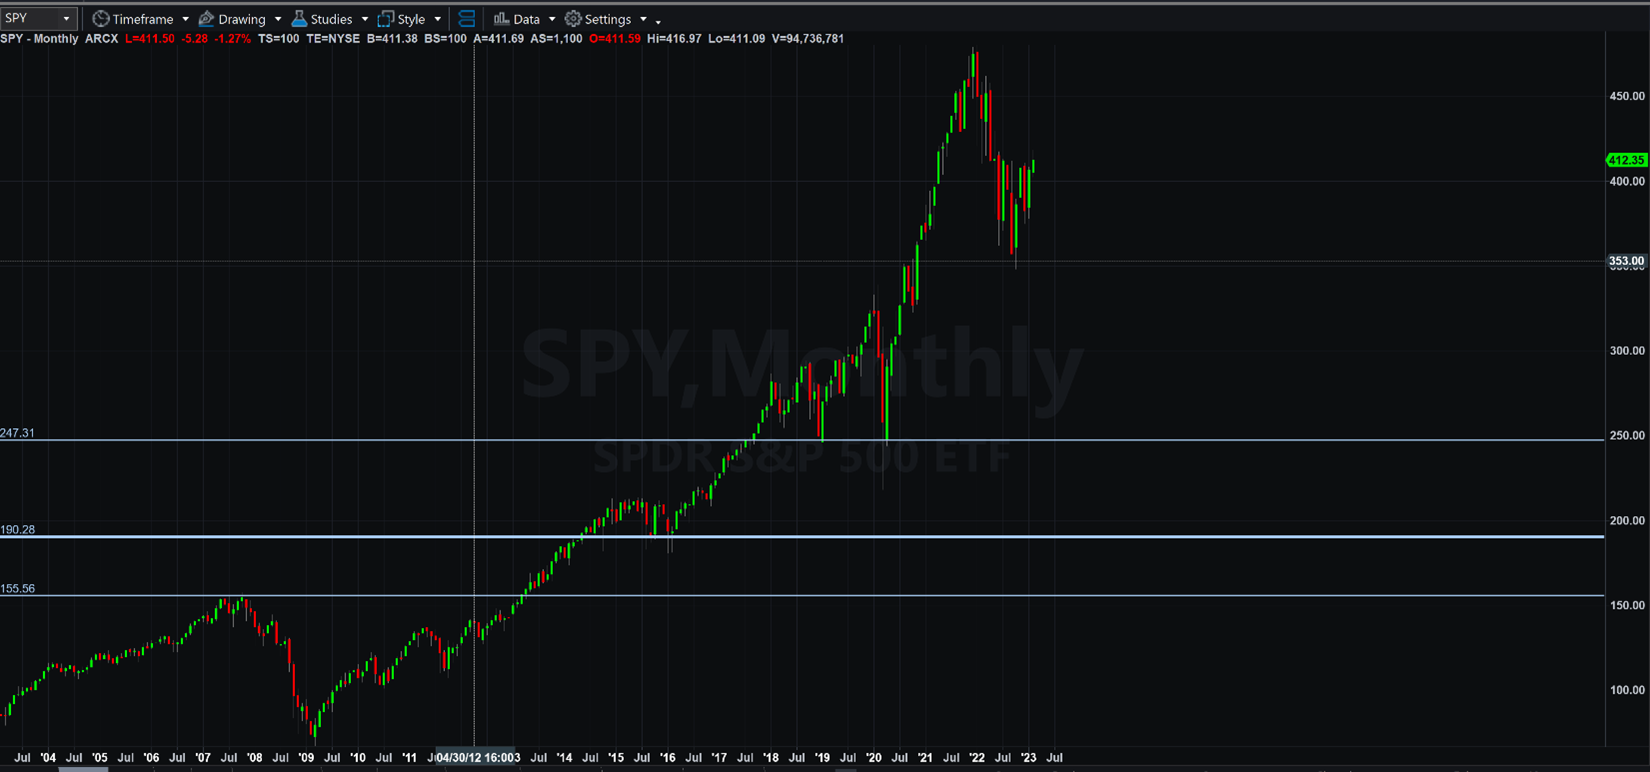
Note that I have drawn three horizontal lines on the price chart.
Should stock prices fall to the most obvious strong area of support, as noted by the top horizontal line, there would be a further decline in stock prices of about 40%.
Should prices fall to the second (or middle) horizontal line I’ve drawn on the chart, that would mark a decline of about 54% from these levels.
And, should stock prices fall to the levels noted by the third (or bottom) horizontal line on the chart, that would be about a 62% declines from these levels.
While the ‘buy the dip’ mentality seems to be dominating stock investors’ actions at this point, I expect a lot more downside in stocks before the bottom is finally in. I also believe that may mark a terrific opportunity to invest in stocks.
I am often asked for my ultimate stock forecast. While it’s impossible to predict the future actions of the Federal Reserve, I think that we will see additional downside in stocks of 40% to 60%.
Until we reach that point, I am of the opinion that many investors would be well-served to take a cautious and deliberate approach to managing assets.
The radio program this week features an interview with Dr. Charles Nenner.
Dr. Nenner is a highly regarded cycles analyst, and I get his forecast for markets moving ahead based on his cycles research. You can listen now by clicking on the "Podcast" tab at the top of this page.
“In a time of universal deceit, telling the truth is a revolutionary act.”
George Orwell

Comments