
 Weekly Market Update by Retirement Lifestyle Advocates
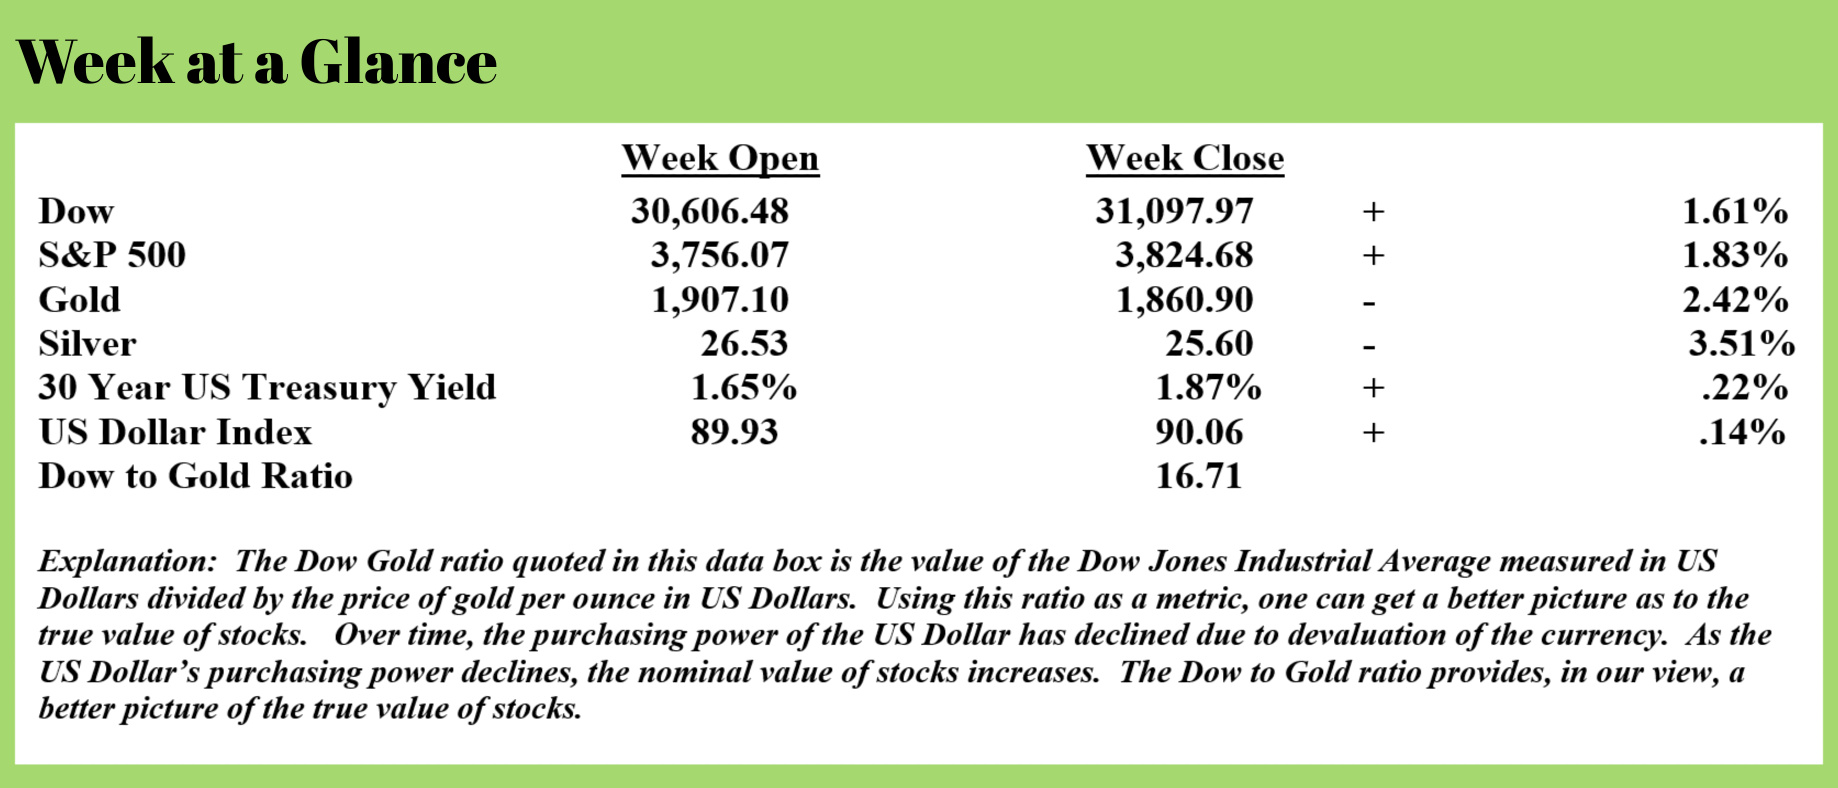
Stocks advanced last week while precious metals pulled back. US Treasuries fell hard as yield increased and the US Dollar was marginally stronger as measured by the US Dollar Index. (Note: that does not mean the US Dollar was stronger in absolute terms but it was stronger against other, fiat currencies).
This week, a couple of observations.
One, food inflation rose for the seventh consecutive month as I predicted we would continue to see. Dairy products and vegetable oils rose most. This from “Zero Hedge” (Source: https://www.zerohedge.com/commodities/global-food-prices-rise-seventh-consecutive-month) (emphasis added):
The Food and Agriculture Organization's Food Price Index rose for a seventh consecutive month in December, led by dairy products and vegetable oils.
The FAO Food Price Index averaged 107.5 points last month versus 105.2 points in November.
The benchmark, which tracks global food prices of cereals, oilseeds, dairy products, meat, and sugar, averaged 97.9 points for 2020, a three-year high, and a 3.1% rise from 2019 levels.
The global food index was still down 25% from its historical high reached in 2011.
Vegetable oil prices saw the most significant jump, up 4.7% month-on-month in December after surging more than 14.0% in November. The index was up 19.1% in 2020 over the prior year.
FAO explained that soaring vegetable oil prices are due to "ongoing supply tightness in major palm oil-producing countries. International trade was affected by a sharp hike in export duties in Indonesia. International prices for soy oil rose in part due to prolonged strikes in Argentina that impacted both crushing activity and port logistics."
Cereal prices rose 1.1% from November and for all of 2020 averaged 6.6% over the prior year. The reason for the increase is that export prices for wheat, maize, sorghum, and rice all rose last month due to growing condition concerns in North and South America and the Russian Federation.
Earlier this week, we highlighted drought conditions materialized in Argentina resulted in corn (maize) prices trading in Chicago surging to 6-1/2 year highs.
Rome-based FAO said the dairy index increased 3.2% on the month, but for the year, it was flat compared to 2019.
The meat index increased 1.7% last month, while its average this year was 4.5% below that of 2019.
Everyone's favorite permabear, SocGen's Albert Edwards, who, unlike Goldman Sachs, is starting to worry about soaring food inflation, writes FAO Food Price Index been surging over the last few months.
With the FAO food index continually rising, Edwards notes that "annual inflation in cereals reached 20%, the highest annual rise since mid-2011 when the Arab Spring was in full flow!"
Edwards makes his feelings clear on who ultimately was to blame for the global tidal wave in food inflation back in 2011: "Despite Ben Bernanke's denials that the Fed's QE policies caused rampant food price inflation in 2011 (link), many economists such as myself believe that was absolutely the case."
Edwards summarizes his concerns best with the following statement: "even in the richest country in the world, food poverty has become a real problem during this pandemic."
This leaves us with the next imminent food inflation crisis as central banks are mindlessly injecting a record $1.4 billion in liquidity into capital markets every hour.
Soaring food inflation may result in social-destabilization; the question is where will it start?
From my perspective, Edwards is spot-on correct; food inflation in 2011 was a direct result of the Fed’s QE policies or money printing. Of course, Mr. Bernanke, who was at the helm of the Fed at the time, denied that the Fed’s policies had anything to do with food price inflation. To admit money printing created food price inflation would be to admit failure.
History teaches us beyond any doubt that when money is created in sufficient quantity, price inflation is the result. That was the case in 2011 and that is once again the case now. And, unless monetary policies change in the future, inflation will continue to accelerate.
As the piece quoted above notes, the current rate of money creation is literally mind-blowing; $1.4 billion every hour!
More inflation is inevitable.
As we move ahead through what is shaping up to be another tumultuous year or few months at a minimum, we will continue to monitor money creation levels and make suggestions and recommendations accordingly.
My second observation this month, which not surprisingly has gone unreported by MSM, is that in December the Fed decided to change the way that the money supply is reported. Long-time readers of “Portfolio Watch” know that the Fed presently reports M1 money supply and M2 money supply.
M1 is money that is immediately available while M2 is the total of M1 plus savings accounts and time deposits.
The Fed long ago (2006) ceased to report the M3 money supply as it inflated the money supply to deal with the imminent banking crisis.
This from Dave Kranzler at Investment Research Dynamics (Source: https://investmentresearchdynamics.com/the-fed-is-about-to-go-weimar-gold-and-silver-will-soar/) (emphasis added):
Thus, it’s not a coincidence that the Fed’s decision to obfuscate the movement of funds from M1 to M2 occurred after a parabolic shift of funds into M1 commenced. The change is retroactive back to May 2020, which is around the time of the movement of cash from M2 to M1 started to go vertical. While the movement of funds continues, the change in the Fed’s reporting of the “M’s” will make it impossible to see it as it happens.
In that regard, the Fed has taken further steps to increase the opacity of the monetary aggregates. This is direct from the Fed’s website: “Of particular note, the publication frequency of the release will change from weekly to monthly, and the release will contain only monthly average data.” The Fed also will no longer publish non-M1/M2 account balances, like institutional money funds, which help enable the reconstruction of M3.
In addition to the reporting of the numbers monthly rather than weekly, the H.6 statistical release will provide components of the monetary aggregates only “at a total industry level without a breakdown of components by banks and thrifts.” Well, guess what? The breakdown by the bank and thrift components contains the data that truth-seeking Fed analysts would like to see. The last weekly statistical release will be on February 11, 2021. And the data will be cleansed retroactive back to May 2020. Again, no coincidence with the May 2020 retroactivity.
Two points of clarification:
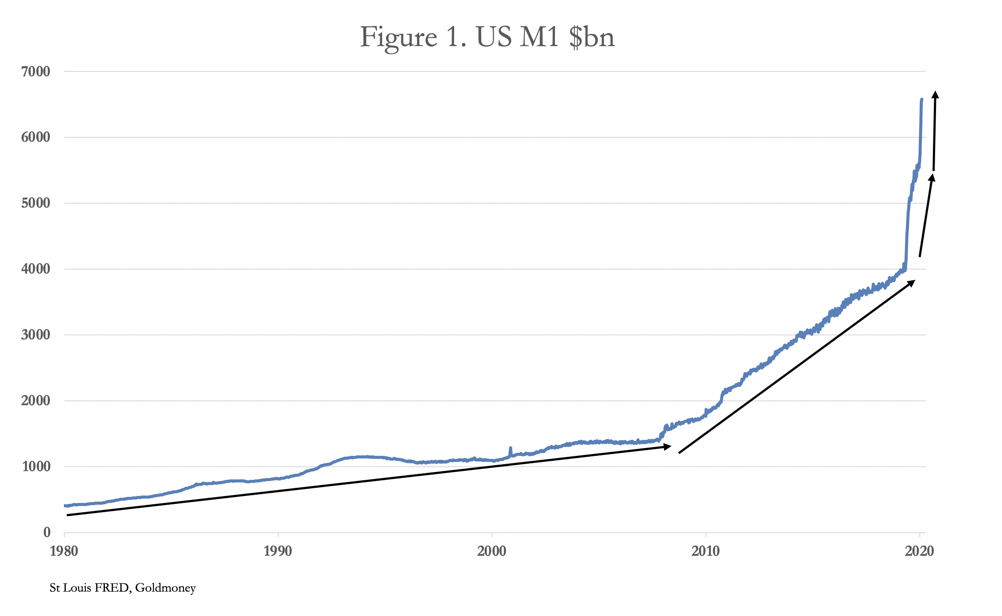 One, the money supply went vertical in May due to colossal levels of money printing and has remained on that trajectory ever since. The chart on this page, prepared with data from the Fed, reflects this fact. The new money supply reporting methodology will change retroactively to May effectively changing the data that has already been reported.
Two, the reporting frequency of the money supply will move from weekly to monthly. So instead of publishing the data about 4 times monthly, the data will only be published once monthly. On top of that, the data will be only monthly average data; in other words, the data will be manipulated before it is reported.
This change is not shocking or surprising.
Over the past 40 years or so, whenever reported economic data begins to look bad or concerning, the reporting methodology is changed to make the data look better. This is exactly what is happening again.
We are truly living in a time where the emperor has no clothes. There are many examples of it. You are all undoubtedly familiar with this childhood story.
A team of tailors arrives on the scene and tells the emperor that they can make him an exquisite suit of clothes that will also distinguish the fools from the wise; only those unfit for the jobs and positions they hold will be unable to see the suit, the wise will be able to see the suit clearly.
The charlatan tailors begin to sew the suit of clothes using imaginary cloth and needles with imaginary thread. The king sends delegations to review the progress of the suit’s construction. Not wanting to be seen as unfit for their jobs, the members of the delegation admire the cloth and comment on how nicely the suit is coming along.
When the big day came and the emperor was to show off his new suit, he was walking through the streets in his underwear with all the king’s servants and employees admiring how beautiful the new suit of clothes was.
Everything was fine until a child, seeing the emperor was nearly naked, whispered that the emperor had no clothes. Soon, the message spread through the crowd until it reached the emperor who suddenly was faced with the reality that the suit was merely make-believe.
Here’s my take. There are many, many aspects of our world that now resemble an imaginary suit of clothes and we are but one whisper away from having to face reality. It is that whisper that will wake everyone and alert them to the fact that what seemed mainstream was merely fantasy.
Thank you all for your continued support and referrals. If you are not participating in our weekly Monday update webinars, you can get more information on them at www.RetirementLifestyleAdvocates.com or catch the replays there.
If you need more information about the webinars or would like to schedule a phone conversation to discuss precious metals or tax planning, just give the office a call at 1-866-921-3613.
This week’s radio program is a ‘best of’ program featuring an interview with author, frequent television and radio commentator John Rubino of www.dollarcollapse.com.
The interview is available at www.RetirementLifestyleAdvocates.com.
“Politics is the art of preventing people from taking part in affairs which properly concern them.” - Paul Valery
