
 Weekly Update from RLA Tax and Wealth Advisory
By: Dennis Tubbergen
Food Prices Spike in December
Seems that inflation in the food sector may be heating up again if December food prices are any indication.
The Consumer Price Index for the ‘food at home’ category is up 30% since 2020. Month-to-month, from November to December, the ‘food at home’ Consumer Price Index jumped .72%, which is about 9% on an annualized basis. (Source: https://wolfstreet.com/2026/01/15/food-inflation-gets-hot-but-not-every-item-a-look-at-beef-chicken-coffee-eggs-dairy-fresh-fruit-vegetables-other-foods/)
Beef prices were up 1% month-over-month for an annualized rate of about 12%. Ground beef has become particularly expensive. On a month-over-month basis, ground beef prices were up nearly 2.5%, which is about 30% on an annualized basis. Ground beef prices are up 72% since the calendar year 2020.
Sugar, sweets, fats, and oils were also up on an annualized basis of more than 30%.
While the rate of inflation may have slowed some recently, it is still an economic headwind as the December numbers illustrate. Here is another argument for some tangible assets in your portfolio.
Real Estate Foreclosures Up in 2025
If you have been a long-term reader of “Portfolio Watch”, you know that I have forecast a stagflationary outcome for the US economy. Simply defined, that is an economic contraction combined with rising consumer prices.
Stagflation also sees the price of speculative assets like real estate and stocks decline, at least in real terms. Priced in gold, which has been money for most of recorded history, both stocks and real estate are falling in price.
I’ve used this example often previously, but it does a nice job making this point so please forgive me if you’ve seen it already.
In 1971, when the US Dollar became a fiat currency when the gold backing of the US Dollar was rescinded, the median price of a home on the secondary market was about $25,000, and the price of gold per ounce was $35. That meant it took 700 ounces of ‘real money’ (gold) to buy the median-priced home.
Today, the median price of a home on the secondary market is about $400,000 (Source: US Census Bureau; https://www.census.gov/construction/nrs/current/index.html). Since gold has been selling around $4500 per ounce (more as I write this), the median home can be purchased with just 89 ounces of gold.
The 700 ounces of gold that would have purchased one median-priced home in 1971 now buys nearly 8 median-priced homes. That’s deflation in real terms.
But now, we’re also seeing the beginnings of deflation in nominal terms. Calendar year 2025 saw home foreclosures rise by 14% from 2024. (Source: https://www.theepochtimes.com/business/us-foreclosures-up-14-percent-in-2025-florida-tops-states-5971745)
Florida led the nation in the number of foreclosure filings on a percentage basis, with 1 in 230 housing units now in foreclosure. Florida is followed by Delaware, South Carolina, Illinois, and Nevada.
When looking at metro areas with a population of one million or more, New York City leads the way in foreclosures, followed by Chicago, Houston, Miami, and Los Angeles.
I look for this trend to continue and intensify.
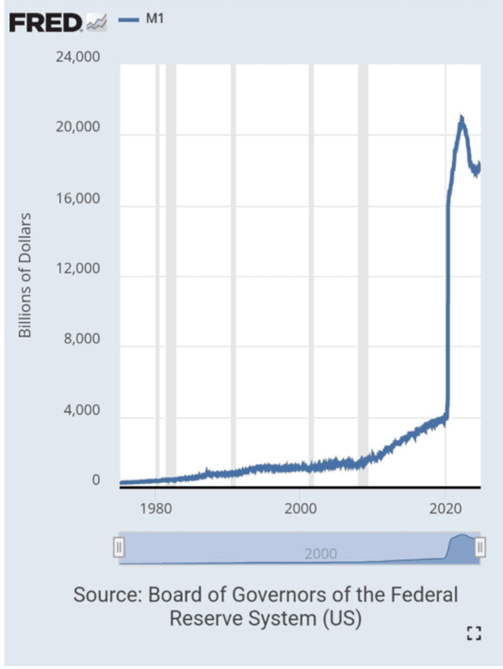
Crazy – 80% of US Dollars were ‘created’ within the Last Five Years
 That is not a tin-foil hat statement; it’s reality. Harsh reality.
The chart on this page is from the US Federal Reserve, and it reports the M1 money supply.
If you’re not familiar with the M1 money supply, it is the total amount of liquid cash circulating in the economy. It includes cash, traveler’s checks, demand deposits like checking accounts, and savings accounts. It does not include time deposits like CD’s, where the cash is less liquid.
With that explanation in mind, look at the chart. From 2020, the M1 money supply increased from about $4 trillion to more than $20 trillion. That means that $16 trillion of the $20 trillion comprising M1 has been ‘created’ over the last five years.
It’s important to remember that merely creating currency does not create inflation. But when a newly created currency is added to the currency already in circulation in the economy, price inflation is the outcome. While M1 has contracted of late, slowing the rate of inflation, M1 is still 500% higher than in calendar year 2020.
Trump Administration Kills the 50-Year Mortgage Idea, Adopts Plan B
The Trump Administration has now backed away from the concept of a 50-year mortgage. Instead, Mr. Trump announced that he is considering an executive order that will allow home purchasers to use 401(k) plan or 529 plan assets for home down payments. (Source: https://www.housingwire.com/articles/trump-mortgage-retirement-downpayment/).
Separately, Mr. Trump had Fannie Mae and Freddie Mac buy $200 billion in mortgage-backed securities. The move was designed to get mortgage rates lower. It worked to some extent as 30-year mortgage rates fell below 6% for the first time in three years. In reality, it’s QE by another name.
RLA Radio
The RLA radio program this week features my commentary and an interview with Mr. Murray Gunn, Head of Global Research at Elliott Wave International. The program is posted and available now by clicking on the "Podcast" tab at the top of this page or you can find it on your favorite podcast channel.
Quote of the Week
“When a comic becomes enamored with his own views and foists them off on the public in a polemic way, he loses not only his sense of humor but his value as a humorist.”
-Johnny Carson

Comments