
 Weekly Market Update by Retirement Lifestyle Advocates
I have long suggested that the debt levels that exist in the economy, both in the private sector and on the balance sheet of the federal government, would lead to a hugely deflationary environment.
Deflationary environments see the value of stocks and real estate decline. Presently, stocks have just made new all-time highs, slightly surpassing the market highs seen at the end of 2021.
At this point, from my analysis, stocks could see at least a short-term pullback. With the Federal Reserve poised to cut interest rates this year, we will have to wait and see if another stock bubble can be created.
As far as real estate is concerned, the data continues to suggest that a downside awaits.
This past week, Wolf Richter offered some real estate insights. This from his piece (Source: https://wolfstreet.com/2024/01/19/amid-collapsed-demand-for-existing-homes-prices-drop-further-supply-highest-for-any-december-since-2018-new-listings-come-out-of-the-woodwork/)
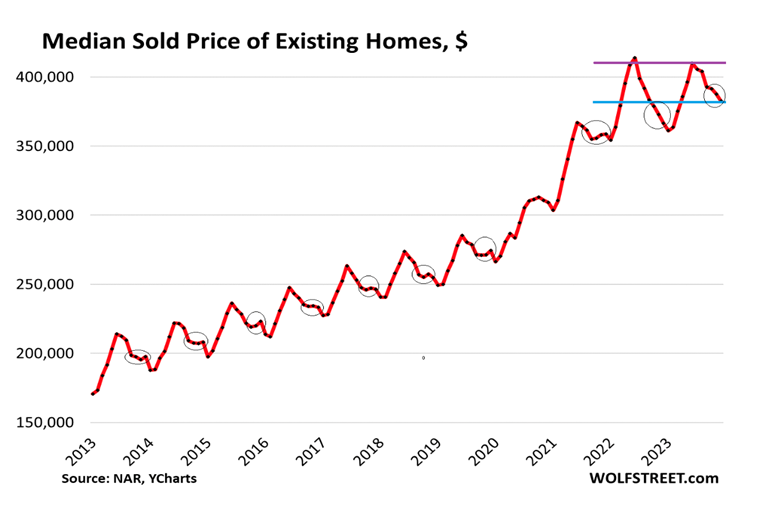
The median price of existing single-family houses, condos, and co-ops in the US whose sales closed in December dropped to $382,600, down by 7.5% from the peak in June 2022, according to data from the National Association of Realtors (NAR) today.
This puts 2023 on record as the first year since the Housing Bust when the seasonal high in June was below the seasonal high (and all-time high) a year earlier. Given the price surge in the spring 2023, the median price was 4.4% higher than in December a year ago.
In another unusual development, prices have dropped every month since June – it’s unusual because seasonally, before the pandemic, there were upticks and flat spots in October through December periods, the little hooks in the chart (circled). There were no such upticks or flat spots in 2022 and 2023; prices fell right through that October-December period (historic data via YCharts):
 The seasonally adjusted annual rate of sales of existing homes fell to 3.78 million in December, the lowest since the worst two months of the Housing Bust in 2010. For the whole year, sales fell to 4.09 million, the worst year in the NAR’s data that goes back to 1995.
Sales compared to prior Decembers (historic data via YCharts):
- From 2022: -6.2%.
- From 2021: -37.9%
- From 2020: -43.2%
- From 2019: -31.6%.
- From 2018: -24.4%.
Actual sales – not the seasonally adjusted annual rate – fell to 297,000 homes, down by 42%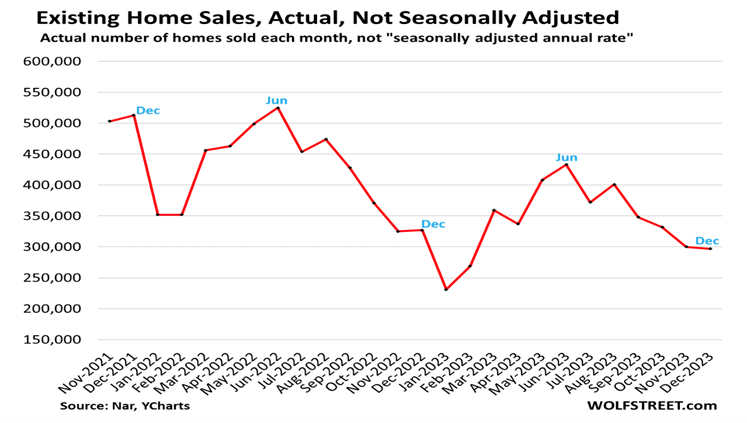 from December 2021.
Seasonally, January and February mark the low months of the year in terms of closed sales. Sales that closed in those two months reflect the lull in deals over the holidays. June is usually when closed sales peak, reflecting deals made during the end of “spring selling season” in April and May. During the second half of the year, closed sales declined (data via NAR).
Months’ supply, at 3.2 months, was the highest for any December since 2018 (when a surge in mortgage rates due to Fed rate hikes slowed the housing market). And it matched 2017. Months’ supply is the result of sales that collapsed while sellers were still trying to outwait this situation (historic data via YCharts).
 Active listings always drop sharply in November and December as sellers pull their homes off the market before the holidays. But in November 2023, they rose, and in December, they barely dipped and, at 714,000, were the highest for any December since 2019. The difference between 2019 and 2023 has gotten smaller every month since May. In May 2023, active listings were 50.7% below May 2019. By December, the difference shrank to 30.9%.
New listings of existing homes always drop in the second half of the year, particularly going into the holidays.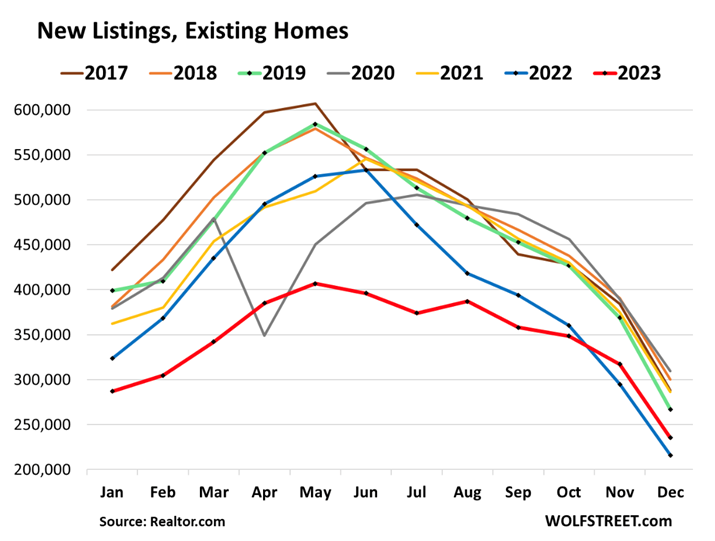
But in the second half of 2023, new listings have fallen less than normal, and the difference to pre-pandemic years narrowed. In December 2023, new listings (red line) were up from a year earlier, and the gap to 2019 narrowed to just 11.8%, down from a gap of over 30% in May and April 2023 (2023 = red; 2019 = green; data via Realtor.com):
Median days on the market jumped to 61 days in December before the homes were either sold or pulled off the market, the highest since March, according to data from realtor.com. This metric reflects in part how quickly sellers pull their listings off the market when they don’t get the hoped-for response:
This is the picture of a market that is frozen. Prices are too high, buyers have gone on strike, demand has collapsed, and sellers are trying to outwait this situation, thinking that this too shall pass.
Homebuilders, however, are not thinking that this too shall pass. They’ve adjusted to the market. They’re building smaller houses with fewer amenities and selling them at lower prices, and they’re buying down mortgage rates, which is expensive and for home builders is like a price cut, and they’re throwing other incentives at buyers, and they have been able to produce decent sales of new homes, taking buyers away from existing homes, and demand for existing homes has collapsed.
Seems that deflation is emerging. And the Fed is poised to use the only tool they have left. Long term, it can’t work.
If you aren’t yet utilizing inflation hedges and deflation hedges in your portfolio rather than the traditional 69/40 portfolio, I would urge you to consider it seriously.
The radio program this week features a conversation that I did with Murray Gunn, Head of Global Research at Elliot Wave International. I get Mr. Gunn’s forecast for several financial markets and chart with him about the fascinating topic of socionomics.
Be sure to check out the interview now posted at www.RetirementLifestyleAdvocates.com.
“You can’t give government the power to do good without also giving it the power to do bad – in fact, do anything it wants.”
-Harry Browne

Comments