
 Weekly Market Update by Retirement Lifestyle Advocates
The double top theory for stocks that I suggested at the end of 2021, is looking like the right call at this point.
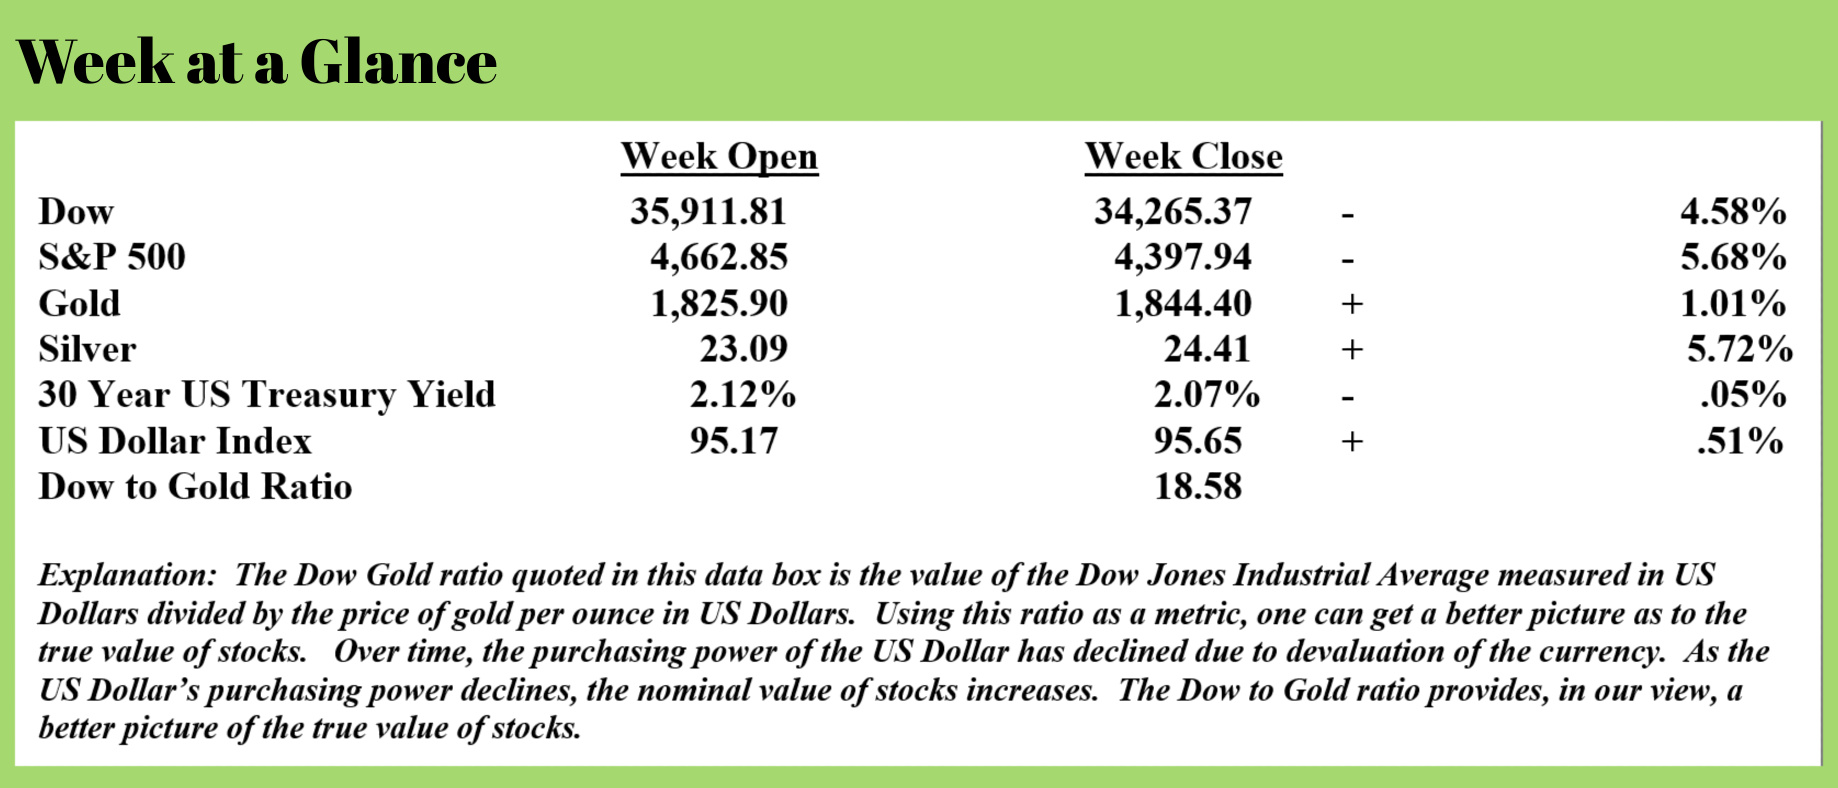
Stocks suffered their worst week since March of 2020 last week despite a 4-day trading week.
As I have been suggesting here each week, when stock gains are largely attributable to an artificial market environment created by easy-money policies, a correction will have to ensue.
The February special report will be an analysis of stocks. Look for an opportunity to get the report in the February issue of the “You May Not Know Report”.
Given the dismal performance of stocks last week, ironically after I wrote about and offered evidence of a bubble in stocks last week, I thought it would be appropriate to dig into this topic a little more deeply.
But, I want to examine this topic from a different viewpoint – the effect that currency devaluation has on stock prices.
Long-time readers of “Portfolio Watch” have seen this analysis in a similar form in the past, but the analysis is important to understanding what is largely behind the stock bull market.
This analysis requires that we define two terms – nominal and real.
Nominal is defined as ‘in name only’. When I say that stocks increased nominally, I am stating that stocks increased in name only.
Real is defined as an actual thing, not imaginary.
The most recent bull market in stocks has been in nominal terms not real terms.
Here is an excerpt from the February Special Report to explain.
Stock analysts rarely discuss the key relationship between stock prices and currency devaluation.
Simply and succinctly stated, as currency is devalued stocks priced in that currency rise in price. This increase in the value of stocks due to currency devaluation is nominal rather than real.
The same currency devaluation or inflation that causes the price of groceries to increase also causes the price of stocks to increase.
Let’s look at an example to make the point.
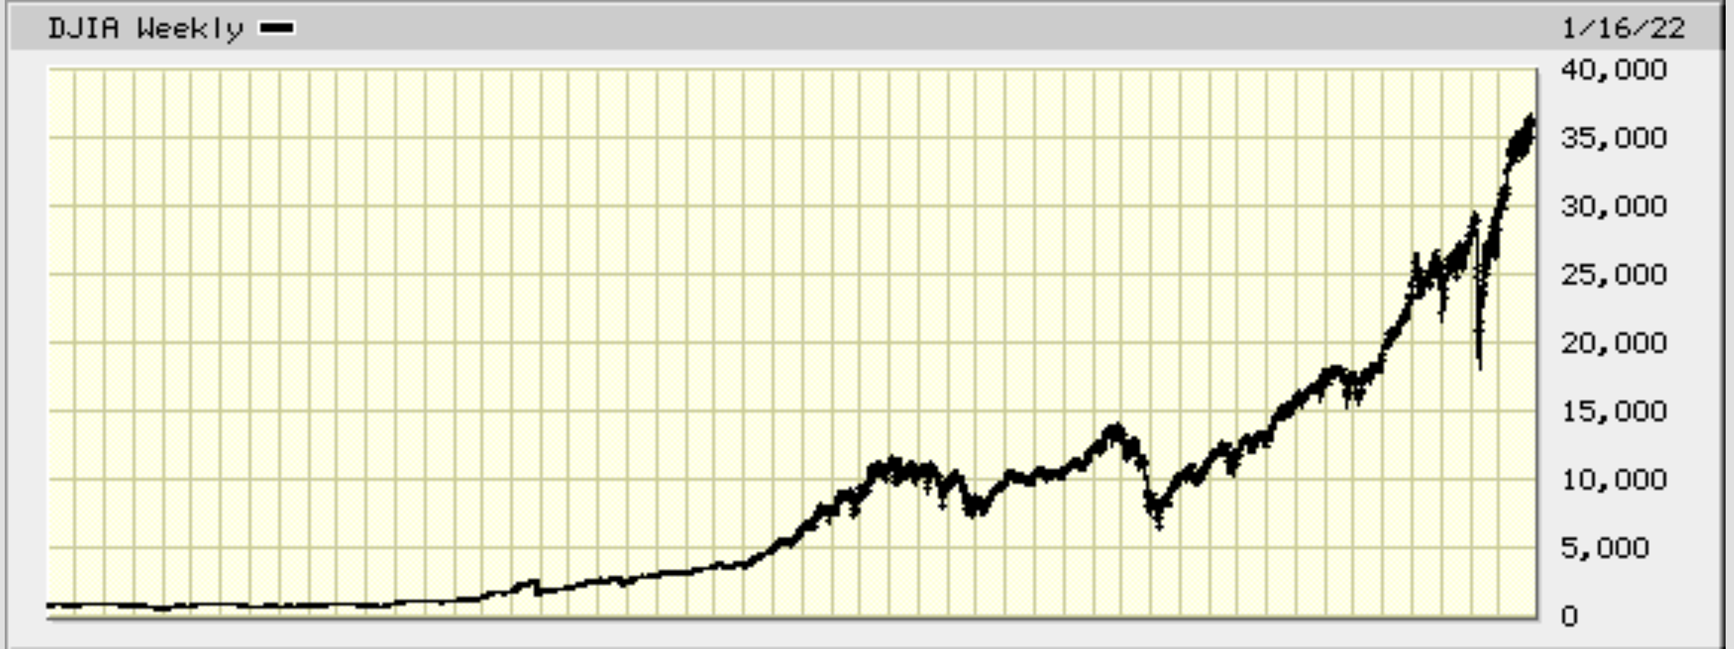
This is a chart of the Dow Jones Industrial Average going back to 1971.
An initial perusal of the chart has one concluding that the Dow reached a level of about 12,000 in 1999 at the peak of the tech stock bubble and a high of about 14,000 at the market peak when the Great Financial Crisis began in 2007. Presently, the Dow has reached about 36,000 at the high.
Nominally speaking, since 1999, the Dow has risen in value by about 300%, from about 12,000 to about 36,000. But what did the Dow rise in real terms?
There are many different methods that are used to calculate the inflation rate. There is the official CPI or Consumer Price Index, as well as more accurate alternate, private-sector inflation calculation methods.
The official inflation rate as measured by the CPI is very manipulated. Alternate measures of inflation offered by www.ShadowStats.com or The Chapwood Index offer better, more accurate inflation estimates but the most accurate measure of inflation is determined by looking at the purchasing power of gold.
It’s been said that a loaf of bread priced in gold costs exactly the same today as it did during the Roman Empire more than 2000 years ago. For more than 5000 years and throughout most of history, gold has been money.
To determine the real performance of stocks, it is helpful to price stocks in gold rather than US Dollars.
In 1999, when the Dow reached a level of 12,000, an ounce of gold was around $250. To price the 1999 Dow in gold, one would take the value of the Dow (12,000) and divide by the price of gold per ounce ($250). That math has us concluding that the Dow was 48 because it took 48 ounces of gold to buy the Dow.
Let’s fast forward to the present time. The Dow was recently 36,000 while gold’s spot price was about $1,800 per ounce. The same math has us buying the Dow for 20 ounces of gold.
Gold, over that 20-year time frame has been constant. An ounce of gold has not changed over the last 20 years, 100 years or even 5,000 years. It is a constant metric. An ounce of gold is the same today as it was at any time historically.
When one looks at the performance of stocks from this perspective, pricing stocks in gold, stocks have actually declined by more than 58% since the tech stock bubble of about 20 years ago in real terms.
Priced in US Dollars, stocks have rallied more than 300% since the tech stock bubble. However, when priced in gold, stocks have fallen more than 58%!
From this analysis, one can conclude that the rally in stocks since the tech stock bubble has been in nominal terms rather than real terms.
A loss in purchasing power causes inflation in consumer items and asset prices – that perfectly explains what we are now experiencing.
The Fed is now painted into the proverbial corner as, at this point, it seems the financial markets have begun to unravel. This piece discussed in the February “You May Not Know Report” newsletter explains. (Source: https://thebaddaddy.com/the-rock-and-the-hard-place/)
Inflation or depression, the authorities are trapped.
They should know this but are drunk on hubris, blinded by money-printing, schmoozed by lobbyists, and too busy insider-trading to care. If they understood this predicament, they’d have retired years ago.
The real problem? In the DC halls of power and its feeder universities, they don’t understand economics. Instead, they parrot dogma dressed up in complex math to justify central planning and fiat money.
Models that actually work (from the Austrian school) are ignored or obfuscated because they don’t consolidate power into a crony, captured system.
Inflation or depression, how did we get here? Ludwig von Mises explained (in 1949)-
“There is no means of avoiding the final collapse of a boom brought about by credit expansion. The alternative is only whether the crisis should come sooner as the result of a voluntary abandonment of further credit expansion, or later as a final and total catastrophe of the currency system involved.”
US stock and bond markets are in an epic bubble, and can only be propped up with more money-printing. But that will cause the prices of beef, milk, eggs, rent, and energy to soar.
The inflation genie is out of the bottle.
To put her back in, they need to stop the easy-money policies, but that will crash the markets, a cascade of debt-deflation (like 2008) that also torpedoes the real economy.
So, which will it be, inflation or depression?
It’ll be an epic tug-of-war as they try to thread the needle. They’ll tighten this year until things start to break, then panic and turn the money spigots back on.
I believe that this excerpt is spot on. Inflation followed by deflation, as I’ve discussed often is the only possible outcome at this point.
This week’s radio program and podcast features an interview with Elliot Wave market analyst Murray Gunn.
I found my conversation with Murray to be fascinating. I got Murray’s forecast for markets but also discussed the social aspects of the current economy.
The relationship between social mood and investment performance is interesting and insightful. You won’t want to miss this interview. Listen now by clicking on the "Podcast" tab at the top of this page.
“When you create, you get a little endorphin rush. Why do you think Einstein looked like that?”
-Robin Williams
