
 Weekly Market Update by Retirement Lifestyle Advocates
On a weekly basis, I speak to a radio show listener or a book reader who is inquiring about our services for clients.
After asking some questions about their retirement goals, what planning they have completed, and learning a bit about their finances, I ask them if they have any idea how their current investments performed during the last major market decline.
It is this question that almost always stumps them.
Yet, it’s an extremely important question to which one should know the answer, especially as one gets closer to retirement and needs to use investment assets to supplement retirement income.
A term that is undoubtedly familiar to longer-term “Portfolio watch” readers is drawdown. Simply defined, drawdown is the percentage decline from the peak price of an investment to the low price of an investment.
During the financial crisis and the stock market decline of 2007 to 2009, it took 20 months for the market to bottom. The drawdown from July 2007 to March 2009 was more than 50%.
An aspiring retiree with $500,000 invested in stocks may have seen her investment account fall to a low of about $250,000 before the market bottom was in and the investments began to recover.
After experiencing a 50% loss in the value of an investment, a 100% gain is needed to get back to a break-even point.
That’s why, as one nears retirement, it’s important to understand drawdown risk and perhaps incorporate some safeguards to avoid participating in a market decline.
Given the current valuation of stocks, I find it remarkable (not a good remarkable) that many retirement account investors have a substantial amount of their portfolio invested in stocks. The 60% stocks and 40% bonds portfolio recommended by many “Wall Street” advisor types will, in my view, fail those who use it in the months ahead.
Stocks remain extremely overvalued from my research. And I am not alone in holding this opinion. A recent guest on RLA Radio, Dr. Robert McHugh, noted that the stock market advance has been led by very few stocks. In other words, while most of the market is flat or even negative, the price moves by three companies have been responsible for the gains posted by the stock market.
This from Dr. McHugh’s analysis (Source: www.technicalindicatorindex.com):
If you study periods of time when the stock market was dominated by a few large corporations, there is a pretty good correlation that these periods lead to economic recessions (and deep stock market declines). Right now, the top 10 market cap stocks are dominating the stock market at the 85% highest level seen in the history of the stock market. This concentration is alarming, and based upon history, is not a bullish condition. Just the opposite. Take a look at the following chart.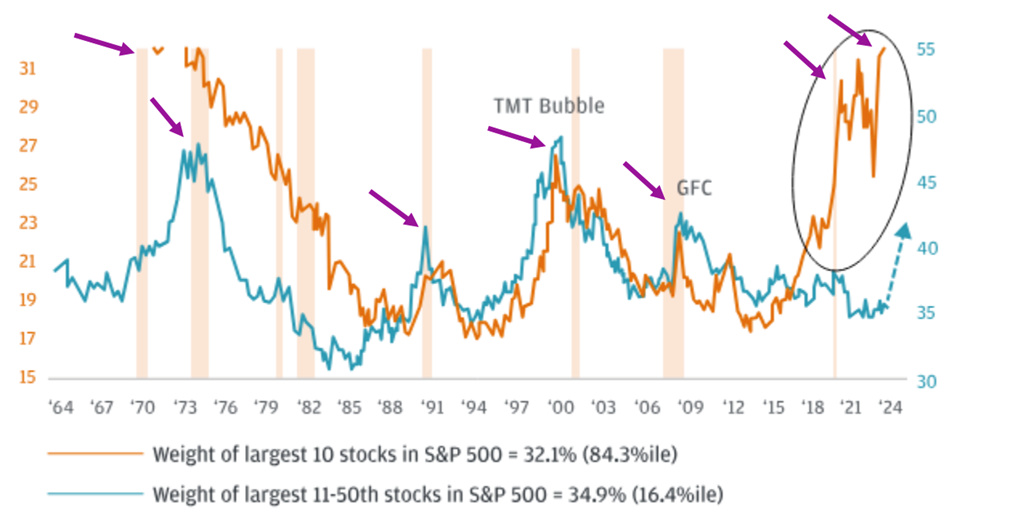
Here we see that several of the economic recessions (and accompanying stock market plunges) of the past 40 years arrived at periods of time when a few mega cap corporations were at an elevated concentration of the entire stock market. This time it is A.I. perceived companies such as Nvidia, Microsoft and Apple dominating the market. These 3 stocks have almost 20 percent of the market cap of the entire stock market.
Bottom line: there is simply not a lot of participation in the latest stock market rally. It is the narrowest rally since the early 1970s which preceded the stock bear market of 1973 and 1974.
Dr. John Hussman, founder of Hussman Funds and a respected market analyst, recently did an interview with Adam Taggert of “Thoughtful Money” (Source: https://adamtaggart.substack.com/p/john-hussman-the-speculative-market). John had some observations about stock valuations.
- John sees current market conditions as highly overvalued. Current valuation extremes parallel past market corrections and bubbles, and he calculates the risk of a 50-70% decline in the S&P 500 based on historical precedent.
- For those wondering why his models started performing less well in the post-GFC recovery: John admits that his investment strategy during the recent bubble was too defensive, a stance influenced heavily by the environment following the global financial crisis. He conducted stress tests that suggested certain market syndromes, historically reliable indicators of downturns, should prompt a defensive position. However, the unique conditions of quantitative easing (QE) and zero interest rates altered typical market behaviors, encouraging continuous speculation despite overextended valuations. This led to a prolonged period where traditional indicators of downturns did not apply as they had in past cycles.
- Since 2021, market internals have not been favorable, suggesting a cautious approach is warranted. John ties this observation to broader economic indicators, particularly in the labor market. The gradual reduction in job openings, a creeping increase in unemployment rates, and a rise in new unemployment claims are signs he watches closely, indicating the potential for recession is rising.
- The historical increases in corporate debt, especially during periods of low interest rates, have heightened the impact of interest expenses on profit margins. He highlights the trend of companies taking advantage of these lower rates to increase leverage, which could pose risks as interest rates rise and debt needs to be refinanced. This could potentially squeeze profit margins in the coming years as higher refinancing costs take effect.
- John is skeptical about the efficacy of any Federal Reserve future rate cuts.
A past guest on RLA Radio, Mr. John Rubino, made three recent observations about stocks, confirming these opinions. He notes that the “Kobeissi Letter” published that the stock ownership percentage as a percentage of other financial assets hit a new record in the first quarter of 2024, rising to 41.6%. That’s even higher than the 38.4% seen at the dot com market peak.
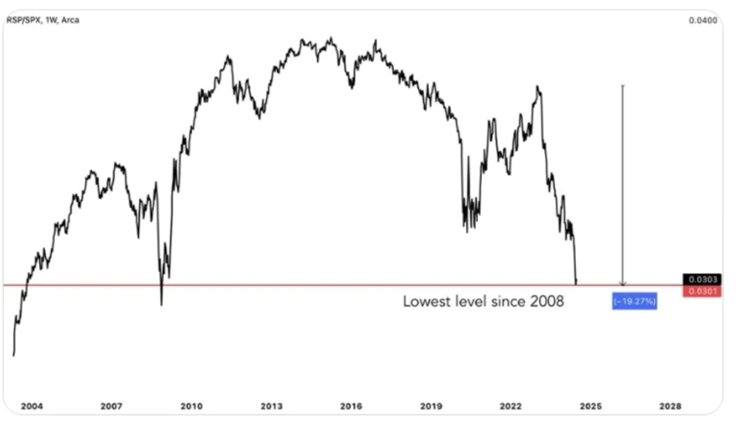
Second, the equal weight S&P 500 relative to the market has dropped to levels last seen in 2008. See the chart.
 Third, US stocks, when measured on a price-to-book basis have never been more expensive when compared to the rest of the world.
On a percentage basis, US stocks are more than 20% more expensive relative to the MSCI World stock index than at the peak of the tech stock bubble.
If you are looking to have a comfortable, stress-free retirement and you’re planning on using some of your investments to supplement your retirement income, think very carefully about your exposure to stocks.
A V-shaped recovery after a correction is not guaranteed.
This week’s RLA radio program features an interview that I conducted with Dr. Robert McHugh, mentioned above.
The radio program is posted. Just click on the "Podcast" tab at the top of this page to listen. The weekly Headline Roundup newscast is also posted there. If you haven’t yet done so, check out the free resources available here on the website.
“Wall Street is the only place that people ride in a Rolls Royce to get advice from those who take the subway.”
-Warren Buffett

Comments