
 Weekly Market Update by Retirement Lifestyle Advocates
To begin with this week, I want to offer an update on last week’s market analysis.
In last week’s “Portfolio Watch”, I wrote this about stocks and published a chart of the S&P 500 (which I am not reprinting here due to space limitations. You can visit www.RetirementLifestyleAdvocates.com and download last week’s newsletter to see the chart):
Let’s begin by taking a look at stocks.
I’ll use the Standard and Poor’s 500 for the analysis. The chart below is of an exchange-traded fund that has the investment objective of tracking the S&P 500 index.
Notice on the right-hand side of the chart, I have drawn a blue trend line that begins at the end of the calendar year 2021 and continues to the present time.
Notice also, how far below the trendline the current price is.
Also on the chart, on either side of the green and red price bars (each bar is one week of price activity with the green bars representing the weeks that the ETF price went up and the red bars representing weeks the ETF price went down), you’ll see a blue line (on the top side of the price action) and a red line (on the bottom side of the price action). Those lines are the Bollinger Band indicator.
When prices reach outside the Bollinger Band, either on the top side or the bottom side, it often represents a price extreme and the price reverts to the mean.
Finally, if you notice on this weekly price chart that last week’s price action ‘gapped down’ leaving a space in the chart between the prior week’s price action and last week’s. Often, gaps on a chart are closed.
For these reasons, I would not be surprised to see a rally in stocks this next week although there is another market axiom that advises to ‘never try to catch a falling knife’. It’s sage advice.
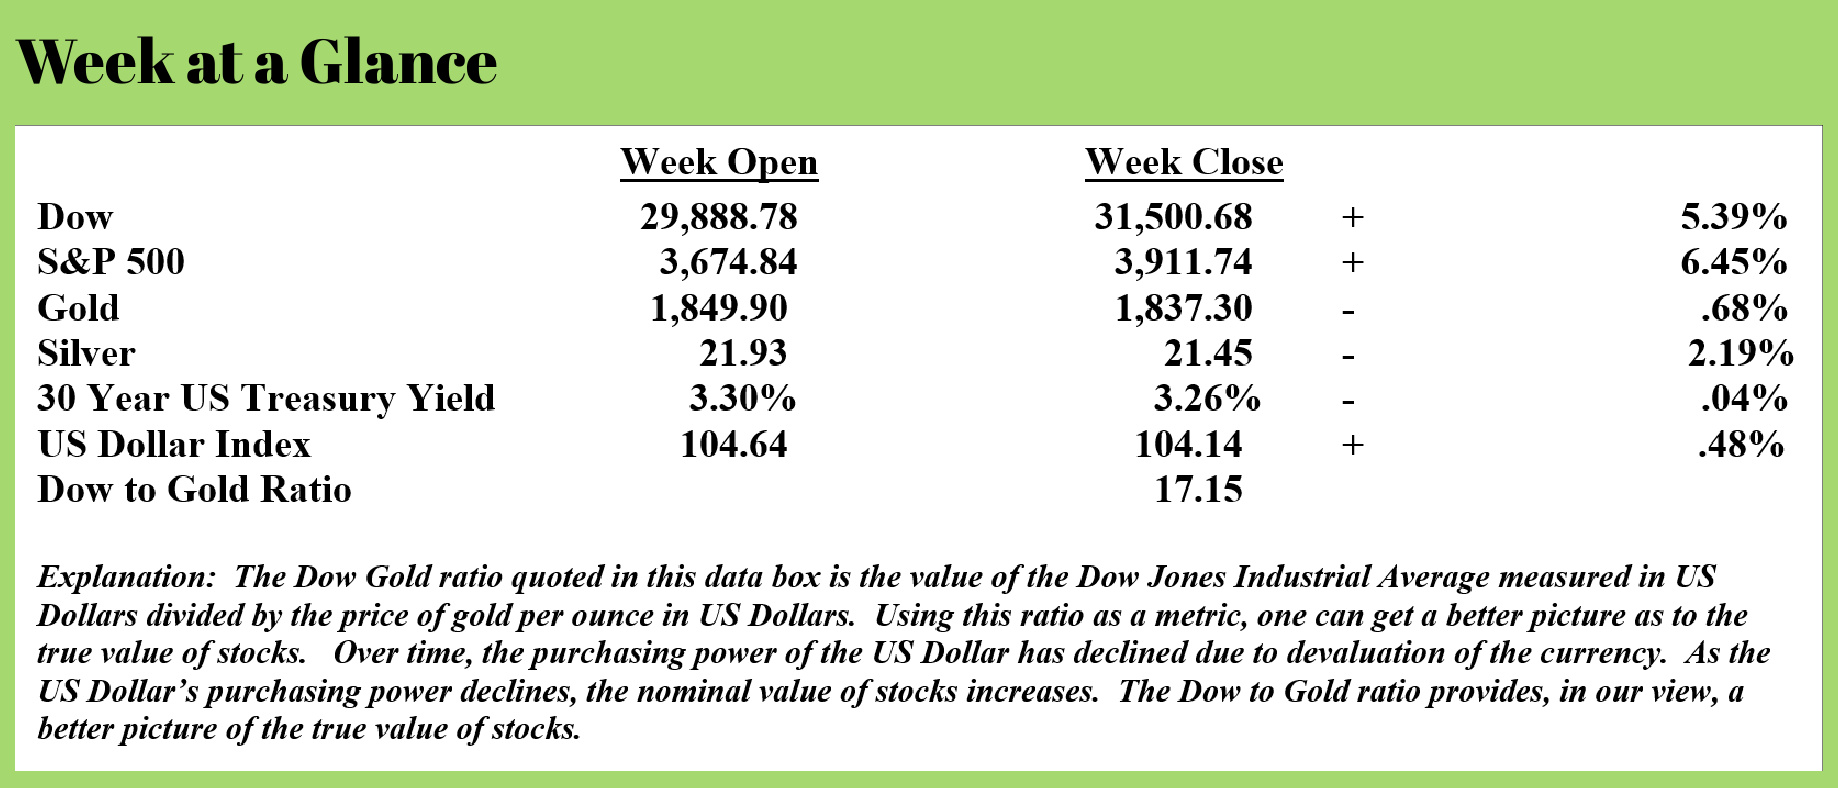
That rally in stocks did occur; the Dow Jones Industrial Average rallied more than 5% and the Standard and Poor’s 500 Index rallied more than 6%. Despite the seemingly strong rally, by measure stocks remain in a downtrend.
The recent rally is counter-trend in my view, with the primary trend remaining down. To demonstrate how far oversold stocks were going into the beginning of last week, stocks can rally another 10% or so from here to get back to a 20-week moving average of price.
While stocks don’t have to rally that much, a consolidation period or a continued bear market rally would be more likely than not here in my view unless there is a geopolitical shock to the markets or some other black swan-type event.
At this point in time, US Treasuries like stocks are oversold just not to the same extent. 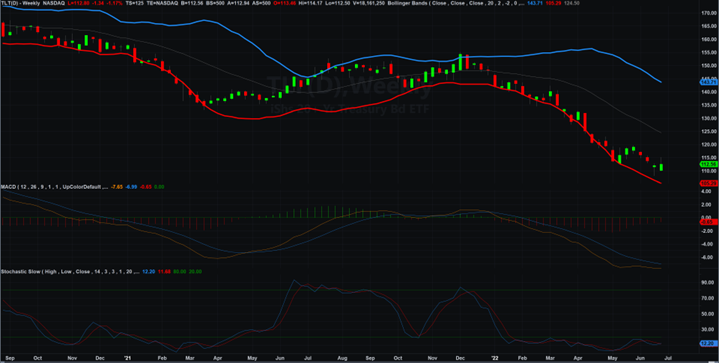
This chart is a weekly price chart of an exchange-traded fund that tracks the price action of long-term US Treasuries.
The faint silver line in the center of the price chart is a 20-week moving average of price. Notice that since the beginning of the calendar year 2022, US Treasuries have been trading well below their 20-week moving average price.
Here’s why that may be important. The 20-week moving average of price is the market’s collective consensus of value over a 20-week time frame. As one might expect, to calculate a 20-week moving average price, one takes the closing price of the exchange-traded fund over the past 20 weeks, adds them up, and then divides by 20.
If the market’s current consensus of value is lower than the market’s consensus of value over the past 20 weeks, that means the market is down trending, at least by this measure.
The indicators at the bottom of the chart measure overbought and oversold conditions (at least that is part of what they do). Both indicators are telling us that the US Treasury market may be poised for a rally here although the indicators are not at extreme levels.
In other news, the G7 announced this past week that Russian gold imports would now be banned. This from “Zero Hedge” (Source: https://www.zerohedge.com/markets/biden-g-7-will-ban-russian-gold-imports) (emphasis added):
“The United States has imposed unprecedented costs on Putin to deny him the revenue he needs to fund his war against Ukraine,” Biden tweeted on Sunday, the first day of a G7 meeting in Germany; a formal announcement is expected later on during the summit.
“Together, the G7 will announce that we will ban the import of Russian gold, a major export that rakes in tens of billions of dollars for Russia” he added.
The official talking point here, encapsulated by the pro-Biden outlet, The Hill, is that "while it does not bring in as much money as energy, gold is a major source of revenue for the Russian economy. Restricting exports to G7 economies will cause more financial strain to Russia as it wages the war."
That, of course, is incorrect: the biggest buyers of gold in recent years have not been G7 countries (United States, France, Canada, Germany, Japan, the United Kingdom, and Italy), many of whom naively sold much if not all their gold in the recent past and have refused or simply don't have the funds to restock; instead, purchases have all been by developing-nation central banks (like India and Turkey, and of course China which however has a habit of only revealing its true gold inventory every decade or so) who have been quietly preparing to do what Russia is doing by dedollarizing and instead allocating capital into a counterparty-free asset.
As for Russia, its central bank has been an aggressive buyer of gold, not a seller, and if anything Biden's decision will only make the gold market the latest to follow the example of oil and bifurcate: cheaper for Russian-friends and much more expensive for Russian enemies.
This decision, like the prior Russian sanctions, will backfire. Russia and its allies will benefit and the west will suffer.
Thinking critically about this policy decision, one has to conclude that the US has decided to prohibit the trading of US Dollars, which are rapidly devaluing, for Russian gold an asset that, at worst, has maintained its purchasing power.
In other words, Russia gets to keep her gold and will not be allowed to exchange her gold for devaluing US Dollars. That’s punishment?
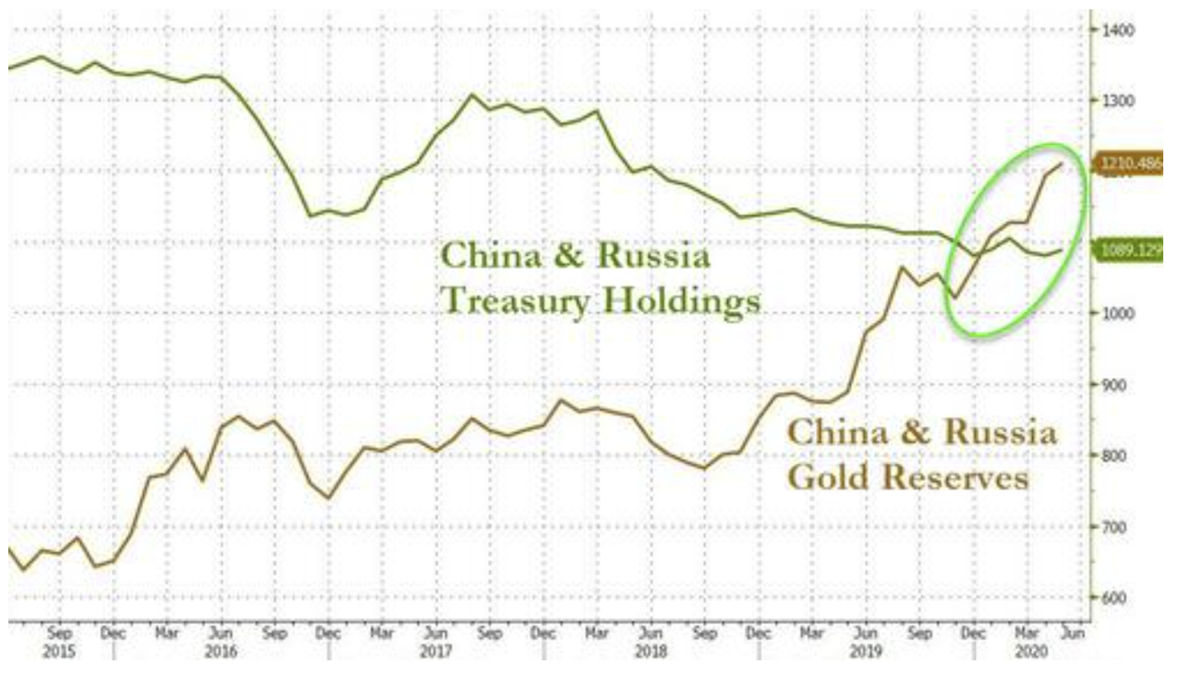 The reality is Russia and China, as the chart above shows, have been dumping US Dollars and adding gold as far as their reserve assets are concerned. The countries have reduced their US Treasury holdings by 25% since mid-2015 and have increased their collective gold holdings by nearly double over the same time frame.
The data unequivocally suggests that Russia (and China) has already made the decision to slow the exchange of US Dollars for gold.
Ultimately, I expect this will be bullish for gold and will continue to be bearish for the US Dollar and other western fiat currencies.
We live in economic times unlike any that anyone alive today has ever seen. Yet, the ultimate destination is completely predictable.
Fiat currencies eventually fail or are redefined. Unsustainable debt levels eventually cause a deflationary collapse and massive currency creation leads to inflation or hyperinflation before the deflationary crash begins.
If you are not using Revenue Sourcing™ to plan your retirement income, now is the time to look into it.
This week’s radio program and podcast features an interview with Mark Jeftovic, the publisher of “The Crypto-Capitalist Letter”. Listen now by clicking on the "Podcast" tab at the top of this page.
“Be careful about reading health books. You may die of a misprint.”
-Mark Twain
