
 Weekly Market Update by Retirement Lifestyle Advocates
The premise of my best-selling book “Revenue Sourcing” is that an aspiring retiree needs to plan for one of two economic outcomes, either inflation followed by deflation or just deflation.
As time has evolved, it has become increasingly apparent that we are seeing inflation soon to be followed by deflation.
Deflation occurs when debt in the financial system exceeds the level that the financial system can effectively purge using ‘honest’ methods. Easy money strategies feed inflation and allow debt levels to build.
When debt is purged from the financial system and deflation emerges, stock prices and real estate prices fall. There is now, in my view, a growing amount of evidence that deflation as a result of debt purging may be beginning to show up.
Stock prices took a big hit last week. This from Yahoo News (Source: https://news.yahoo.com/us-stocks-crater-dow-sheds-202007420.html)
US stocks fell Friday, as each of the three major indexes capped off losing months. The tech-heavy Nasdaq closed out its worst-performing month since 2008, shedding more than 3% for the day as investors fled the e-commerce giant after downbeat earnings.
"Some investors may be hoping for May flowers after these April showers, but historical tendencies suggest bulls should remain vigilant — down Aprils tend to be followed by down Mays," Chris Larkin, Managing Director of Trading at E*Trade said. "And on top of that, May's average return is even worse when the SPX is red for the year heading into the month."
Mixed tech earnings have weighed heavily on investors, as many pandemic winners begin to deflate in the face of tighter monetary policy from the Federal Reserve. The Federal Open Market Committee is set to meet next Tuesday and Wednesday. It is widely expected that the central bank will hike rates by 50 basis points, with markets also pricing in a chance of a 75 basis point hike at the June meeting.
Bank of America trimmed its S&P 500 forecast from 4,600 to 4,500, and its analysts said markets are pricing in a one-in-three chance the US economy will enter a recession.
Cathie Wood's Ark Innovation is about to cap off its worst month ever, with a 29% decline in April. That puts Wood's flagship fund roughly 70% below its record-high in 2021 when pandemic stars like Zoom and Teladoc were surging.
But it may not be just stocks that are feeling the pinch of debt excesses. Real estate may be on the ropes as well. This from Wolf Richter (Source: https://wolfstreet.com/2022/04/26/the-most-splendid-housing-bubbles-in-america-april-update-raging-mania-on-the-eve-of-the-spike-in-mortgage-rates/):
Home prices spiked in crazy leaps – including by about 30% or more in Phoenix, Tampa, and Miami year-over-year – according to the S&P CoreLogic Case-Shiller Home Price Index today. But this raging mania took place with mortgage rates of late last year, given the long lag of the Case-Shiller Index.
The long lag of the Case-Shiller Home Price Index.
The home price data released today was called “February” and represents the three-month average of closed sales that were entered into public records in December, January, and February, reflecting deals that were agreed to a few weeks earlier, roughly in November, December, and January.
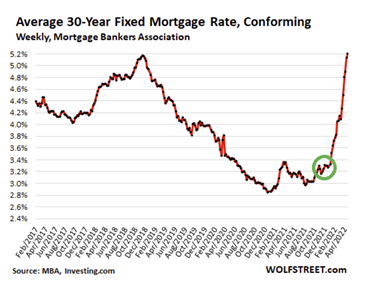 But wait… Many of these homebuyers were pre-approved and had rate locks from prior weeks and months. In November and December last year, the average 30-year fixed-rate hovered at around 3.2%, according to Mortgage Bankers Association data, which is when homebuyers got the rate locks for most of these deals in today’s data (green circle in the chart):
The home price data in the charts below (Editor’s Note: Will be showing only a few of the many charts Mr. Richter published in the article referenced above) does not yet reflect any part of the spike in mortgage rates that commenced in January. But it reflects the crazed run-up beforehand when buyers were desperately trying to buy a home with their still low rate locks.
The mad scramble at the time.
 During the time reflected in today’s Case-Shiller home price data, there was a mad scramble to get the deals done before mortgage rates would rise, and this mad scramble is splendidly reflected here with some crazy spikes.
The overall National Case-Shiller Home Price Index for “February” (average of closed deals entered into public records in December, January, and February, and made in prior weeks and months) jumped 1.7% from the prior month and 19.8% year-over-year.
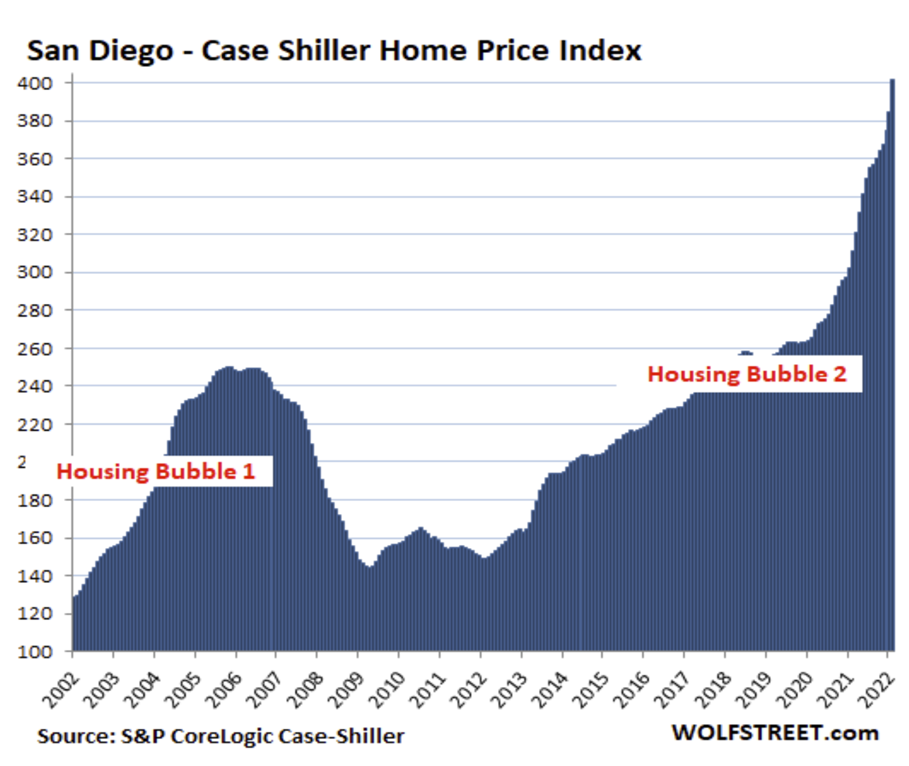
San Diego metro: Prices of single-family houses spiked by a holy-moly 4.5% in “February” from the prior month, and 29.1% year-over-year. The index value of 401 means that home prices exploded by 301% since January 2000, when the index was set at 100.
This price growth amounts to 4.3 times the rate of CPI inflation (+70%) over the same period, crowning San Diego the Number 1 most splendid housing bubble on this list:
Los Angeles metro: The Case-Shiller index spiked by 3.2% in February from January and 22.1% year-over-year. With an index value of 397, house prices exploded by 297% since January 2000, crowning the Los Angeles metro as the Number 2 most splendid housing bubble on this list.
 It’s just house price inflation: the dollar losing purchasing power.
The Case-Shiller Index’s “sales pairs” method – comparing the price of a house when it sells in the current period to the price when it sold previously – tracks how many dollars it takes to buy the same house over time. The index includes adjustments for home improvements. By tracking the purchasing power of the dollar with regard to the same house, the index is a measure of house price inflation.
All charts here are on the same index scale, going just past 400.
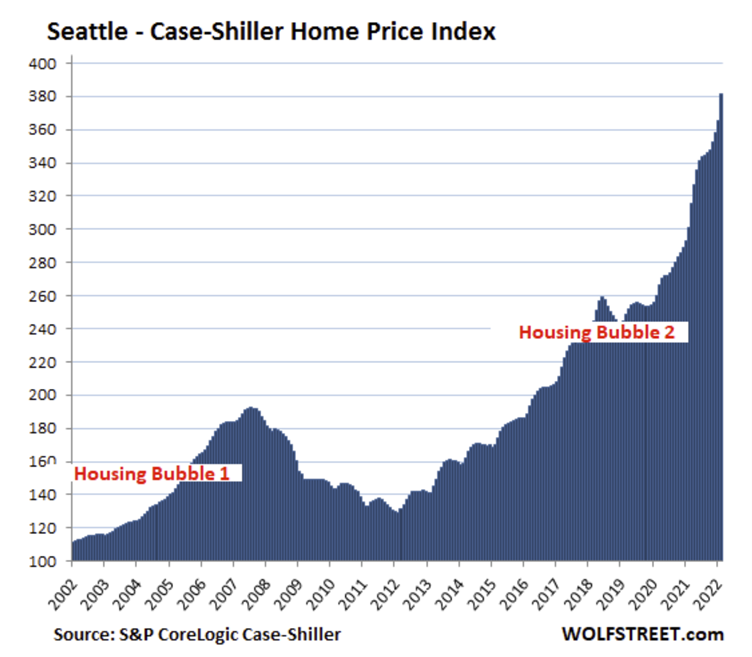
Seattle metro: House prices spiked a holy-moly 4.4% for the month, and 26.6% year-over-year. Since January 2000, house price inflation in the Seattle metro amounts to 281%, four times the rate of CPI inflation:
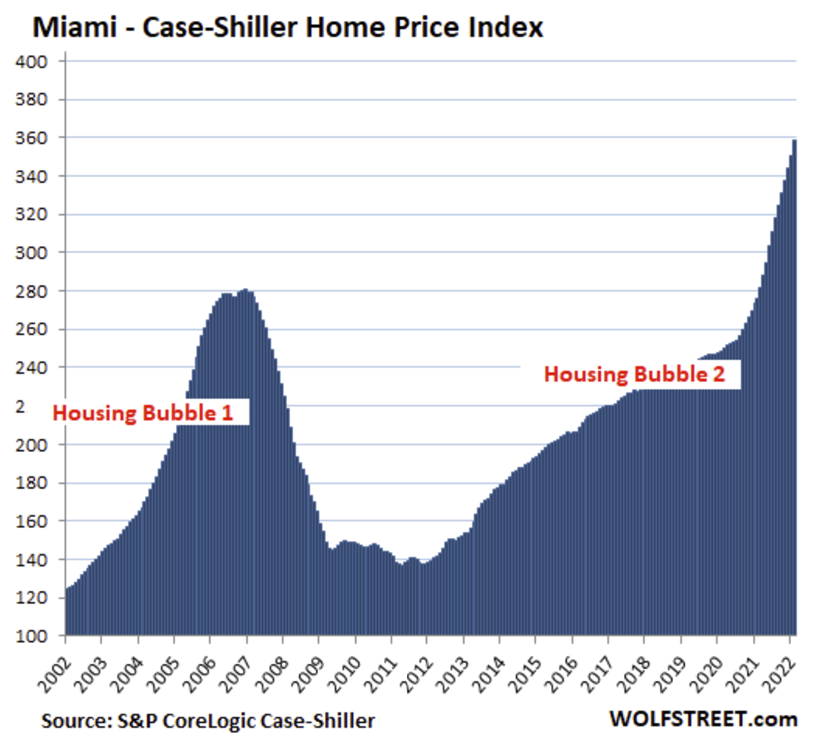
Miami metro: House prices spiked 2.3% for the month, and 29.7% year-over-year, the fastest since January 2006, on the eve of Miami’s can-never-happen-here epic Housing Bust:
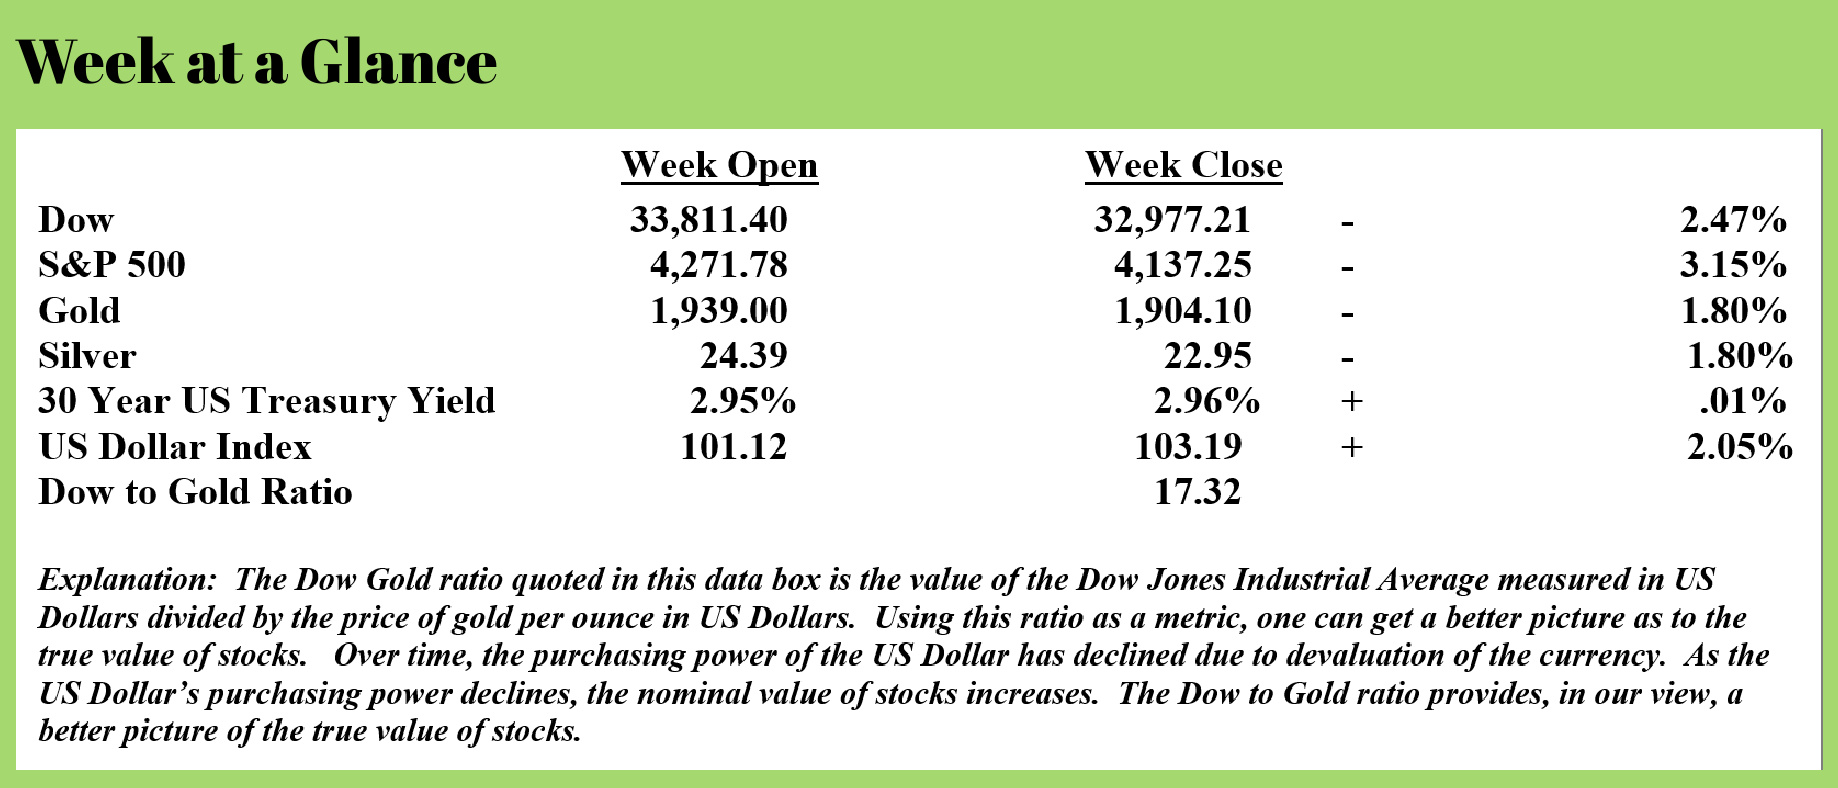
While stocks may already be well on their way to deflating with the S&P 500 stock index down 13.31% YTD, it seems that there are signs the real estate market may soon follow suit.
Should the real estate market and the stock market both see big price declines, we will see inflation subside to some extent (although food prices and energy costs may still rise), but we will then be looking at a different set of economic problems.
The signs of deflation are now coming into view even as inflation is the primary economic trend.
I see asset prices falling and consumer prices continuing to rise moving ahead. That will inevitably lead to a recession.
This week’s radio program and podcast features an interview with Mr. Jeffrey Tucker, founder and President of the Brownstone Institute. I chat with Mr. Tucker about the current state of liberty and the economic outcome that he is forecasting. You can listen to the show now by clicking on the "Podcast" tab at the top of this page.
“By my rambling digressions, I perceive myself to be growing old.”
-Benjamin Franklin
