
 Weekly Market Update by Retirement Lifestyle Advocates
I’ve made the case for a very long time (since my “Economic Consequences” book in 2011) that the easy money policies pursued by the Federal Reserve would ultimately create an environment of inflation followed by deflation.
I made this forecast, which now seems to be coming to fruition, based on what has happened historically when other policymakers at different points in history pursued the same policy.
David Stockman, former Director of the Office of Management and Budget, recently wrote a piece commenting on how the policies of the Federal Reserve over the past 20 years have created an artificial economic environment.
In his piece (Source: https://internationalman.com/articles/david-stockman-on-the-elephant-in-the-room/), Stockman notes just how artificial the low-interest rate environment was:
For more than two decades, these foolish PhDs and monetary apparatchiks drove the entire Treasury yield curve to rock bottom, even as public debt erupted skyward. In this context, the single biggest chunk of the Treasury debt lies in the 90-day T-bill sector, but between December 2007 and June 2023, the inflation-adjusted yield on this workhorse debt security was negative 95% of the time.
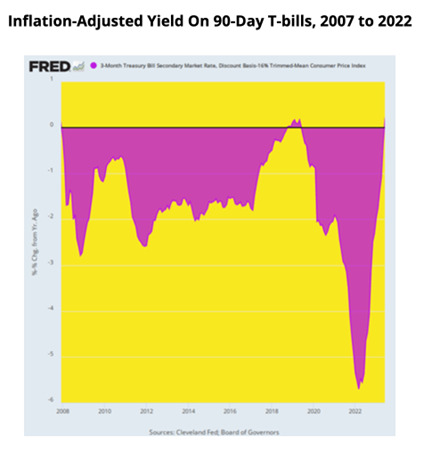 That’s right. During that 187-month span, the interest rate exceeded the running (LTM) inflation rate during only nine months, as depicted by the purple area picking above the zero bound in the chart, and even then, by just a tad. All the rest of the time, Uncle Sam was happily taxing the inflationary rise in nominal incomes, even as his debt service payments were dramatically lagging the 78% rise of CPI during that period.
In his piece, Stockman observes that between the 4th quarter of 1997 and the first quarter of 2022, public debt rose from $5.5 trillion to $30.4 trillion. That’s an increase of 453%.
While debt increased 453%, interest expense, according to Stockman, rose only 73% from $358 billion per year to $635 billion annually.
When one compares those numbers, it’s easy to see how totally artificial the economy over the past couple of decades has been.
This artificial policy would have been great if you owned assets. The wealthiest members of society have benefitted as the price of financial assets has risen dramatically.
Take a look at this chart of an exchange-traded fund that tracks the price performance of the Standard and Poor’s 500.
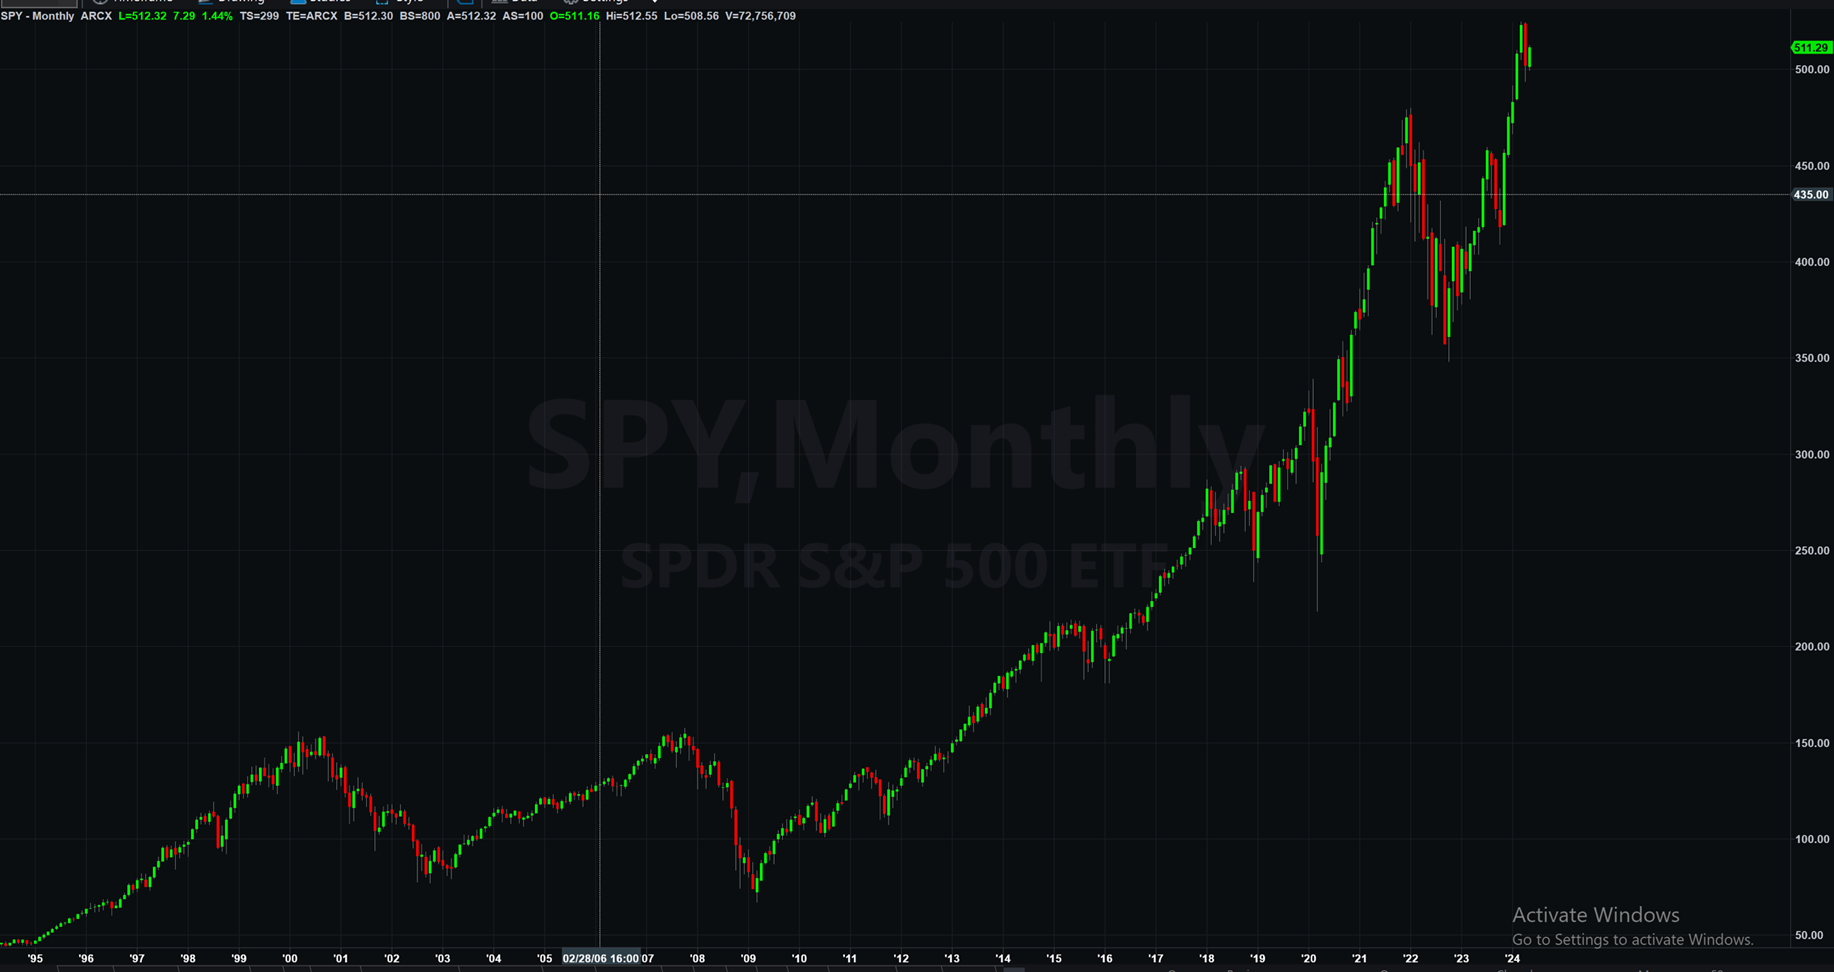 As debt has increased 453%, the value of stocks has increased commensurately.
We could look at real estate values and come to a similar conclusion.
As I noted last week here in “Portfolio Watch,” there are only two options at this time as far as monetary policy is concerned.
One, the Fed stays the course with higher interest rates and does not resort to more quantitative easing. As I’ve discussed here previously, that can only happen if, at some future point, the Washington politicians balance the budget which would result in a deflationary environment like we discussed here last week.
Two, the Fed reverses course and resorts to more easy money policies (which I fully expect), resulting in more inflation before the deflation ultimately kicks in as the debt is dealt with.
The latter outcome is the one that I fully expect to see, resulting in stagflation – more consumer price inflation combined with a contracting economy.
When looking at how more normal interest rates have affected the cost of servicing the national debt, I believe the day of the Fed’s reversing course on monetary policy is sooner than many analysts are suggesting.
 Take a look at this chart from Stockman’s piece.
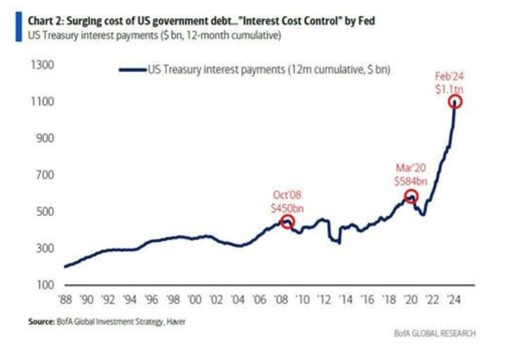
It illustrates the cost to service the debt of the United States government. Note that in October of 2008, annual interest costs on the debt were $450 billion, rising to $1.1 trillion in February of this year.
As interest rates have risen, driving the cost of servicing the debt higher, debt has continued to accumulate and an absolutely alarming trajectory. Here is what Stockman observes in his commentary:
As it is, the public debt is already growing at an accelerating clip, even before the US economy succumbs to the recession that is now gathering force. And we do mean accelerating. The public debt has recently been increasing by $1 trillion every 100 days. That’s $10 billion per day, $416 million per hour.
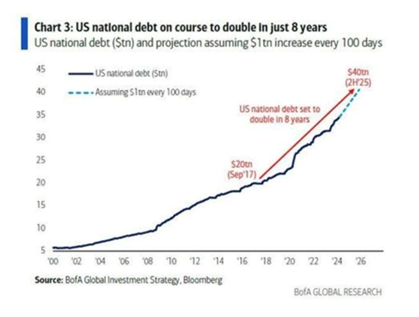 In fact, Uncle Sam’s debt has risen by $470 billion in the first two months of this year to $34.5 trillion and is on pace to surpass $35 trillion in a little over a month, $37 trillion well before year’s end, and $40 trillion sometime in 2025. That’s about two years ahead of the current CBO (Congressional Budget Office) forecast.
On the current path, moreover, the public debt will reach $60 trillion by the end of the 10-year budget window. But even that depends upon the CBO’s latest iteration of Rosy Scenario, which envisions no recession ever again, just 2% inflation as far as the eye can see, and real interest rates of barely 1%. And that’s to say nothing of the trillions in phony spending cuts and out-year tax increases that are built into the CBO baseline but which Congress will never actually allow to materialize.
What is worse, even with partial normalization of rates, a veritable tsunami of Federal interest expense is now gathering steam. That is because the ultra-low yields of 2007 to 2022 are now rolling over into the current market rates shown above—at the same time that the amount of public debt outstanding is heading skyward. As a result, the annualized run rate of Federal interest expense hit $1.1 trillion in February and is heading for $1.6 trillion by the end of the current fiscal year in September.
Did you get that?
By the end of the current fiscal year in September, interest expense will be $1.6 trillion up from $1.1 trillion in February of this year.
That’s half a trillion dollars more in interest costs in just 7 months!
Whether it is this year or sometime in the next couple of years, that will be a budget buster that results in forced austerity or more currency creation.
I’ll bet on the latter.
In the meantime, the rest of the world is watching. The newly expanded BRICS coalition recently reported that it has received applications from more than 40 countries interested in joining. (Source: https://watcher.guru/news/40-countries-ready-to-join-brics-in-2024)
The de-dollarization trend worldwide is continuing.
While precious metals’ prices are experiencing an expected pullback here, I expect more upside for metals as these inevitable consequences become more apparent.
This week’s radio program features an interview that I did with cycles analyst Dr. Charles Nenner. I get Dr. Nenner’s take on financial market cycles as well as political cycles and war cycles. It’s a fascinating conversation.
Be sure to check out the interview now by clicking on the "Podcast" tab at the top of the page.
“If you don’t change what you are doing today, all of your tomorrows will look like yesterday.”
-Jim Rohn

Comments