 Weekly Market Update by Retirement Lifestyle Advocates

This week’s “Portfolio Watch” will offer a preview of some of the information provided in the November issue of the “You May Not Know Report”. You should find that issue in your mailboxes mid-month if you are a subscriber or client.
Our topic for this week is debt.
It's important to measure and monitor the amount of debt that exists in the private sector and compare it to the level of production occurring. It is this trend that impacts the economy more directly than public debt accumulation and money creation. Recently, we discussed the difference between the credit cycle and the currency cycle. In our banking and fiat money system, the credit cycle sees the economy expand through debt. Once debt has reached the system’s capacity to service this debt, the bust phase of the credit cycle kicks in.
This is no different than your household’s finances. If you open a credit line that gives you $100,000 in new spending power and you elect to use it, your household will experience a “boom”, until you reach the limit on your newfound spending power.
Then the “bust” part of the cycle will kick in as you have to deal with the debt you’ve accumulated.
It works the same way in the broad economy. When the system has reached its capacity to service the debt that has been accumulated, the boom part of the cycle stops, and the bust part of the cycle sets in.
In the 2011 book, “Economic Consequences”, I wrote about this relationship between income and debt concluding that debt consumes future production. Because future production is limited or finite, the amount of debt that can be accumulated is also limited.
In the “Economic Consequences” book, I used the example of two neighbors who each wanted to buy the same car.
The first neighbor paid cash for the car, the second neighbor financed the car.
The first neighbor, by having cash in the bank to buy the car was spending prior production to make the purchase. In order to have cash in the bank to pay for the car, she had to go to work and to make money, and then save the money so she could make the purchase.
The second neighbor bought the car by using credit. He took out a loan to buy the car. He is now required to make payments on the car. That means he has to go to work to make money to make the payments on the car. He is spending future production to make the purchase of the car.
Bottom line is that one can only consume through debt accumulation to the extent that there is future production to service the debt.
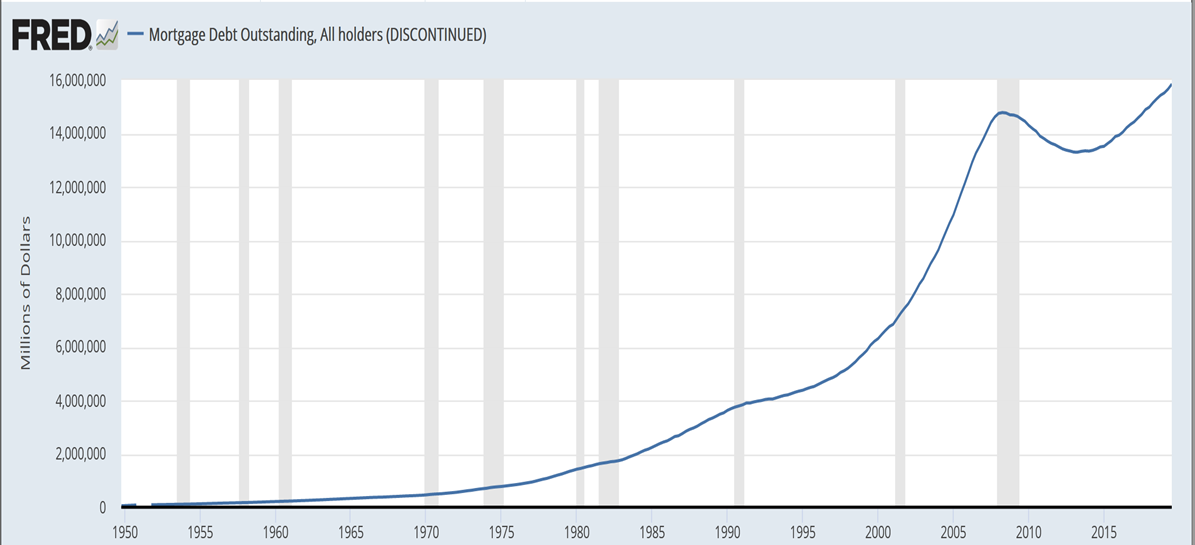
This chart illustrates total mortgage debt. After a slight decline after the financial crisis, mortgage debt is now at all-time highs.
 Student loan debt is also at all-time highs. “Forbes” recently reported that student loan debt now totals approximately $1.6 trillion. This from the piece (emphasis added):
Student loan debt in 2020 is now about $1.56 trillion.
The latest student loan debt statistics for 2020 show how serious the student loan debt crisis has become for borrowers across all demographics and age groups. There are 45 million borrowers who collectively owe nearly $1.6 trillion in student loan debt in the U.S. Student loan debt is now the second-highest consumer debt category - behind only mortgage debt - and higher than both credit cards and auto loans. The average student loan debt for members of the Class of 2018 is $29,200, a 2% increase from the prior year, according to the Institute for College Access and Success.
Credit card debt did decline during the second quarter of this year as was reported in this week's “Portfolio Watch” newsletter.
In our view, this was largely the result of two COVID responses – lockdowns and stimulus.
We’ve had many conversations with friends and clients who’ve related their much lower household spending during the lockdowns while, at the same time, government stimulus to individuals and business was being distributed.
Nevertheless, going into 2020, consumer credit card debt exceeded $1 trillion. This from “MSN” (emphasis added):
Going into 2020, Americans owed more than $1 trillion in credit card debt, after a net increase of $76.7 billion in 2019. One shocker, however, is that the first quarter of the year saw the largest pay down of credit card debt – more than $60 billion.
The second quarter of 2020 dipped just 3 percent with U.S. debtors still paying off an additional $58 billion.
While it is normal to see people pay down bills in the first quarter of a year, drops for the first and second quarters have not happened since 1986.
According to projections from WalletHub, U.S. consumers will end the year with a slight reduction in credit card debt for the first time since the Great Recession of 2009.
Automobile debt now stands at $1.2 trillion. This from Investopedia (emphasis added):
Americans now should a total of $1.2 trillion in auto loan debt – enough to buy 53 million Toyota Camrys at $23,000 a pop. This, according to data collected by LendingTree and found in the Quarterly Report on Household Debt and Credit from the Federal Reserve Bank of New York.1
This level of auto debt is nearly double what it was just 10 years ago, and balances have been climbing for all but two quarters since 2010. In the fourth quarter of 2019, TransUnion estimated that the average auto borrower had a balance of around $18,500.
Private sector debt levels are significant. But, as noted above, in order to determine how these debt levels might affect the general economy, it’s vital to consider total income.
That’s where this analysis gets interesting. As GDP took a historic hit earlier this year, personal incomes rose due to government stimulus for households and businesses. That helped to mask the economic hit and allowed the private sector to keep up with debt service.
While continued economic recovery may help stave off a private sector credit bust, public debt is growing at a totally unsustainable rate.
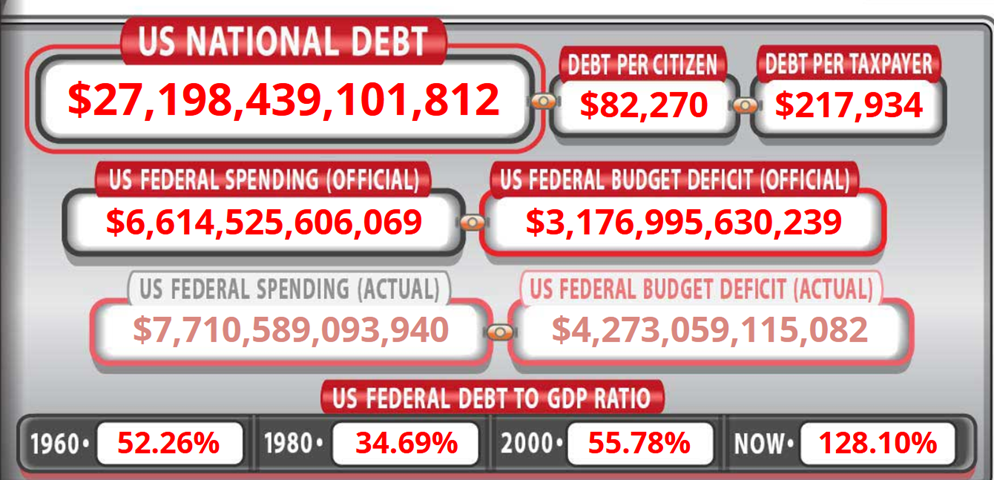
The current, official national debt (as of November 1, 2020) stands at more than $27 trillion.
Perhaps even more disturbing than the level of National debt is the official budget deficit of more than $3 trillion.
As Alasdair Macleod noted, when calculated from March of 2020, the operating deficit is more than $4 trillion.
 The chart, taken from the real-time usdebtclock.org, shows that the current level of national debt per taxpayer is approaching $220,000. According to The Tax Foundation, there are 143.3 million taxpayers who pay an average of $11,165 per year in income taxes. The current debt level would require each taxpayer to pay roughly double their current level of taxes for 20 years IF the debt could be paid interest-free and if the budget were to be immediately balanced.
The obvious conclusion is that income tax rates would have to double to pay off the debt in 20 years if the budget were to be immediately balanced and if there was zero interest on the debt.
And, this doesn’t count the severe underfunding of Social Security and Medicare.
At this point, the Federal Reserve is simply printing money to paper over the massive operating deficit.
This, as we have previously discussed will have to lead to adverse economic consequences. We believe that we are already seeing inflation in many sectors of the economy.
If you have not already positioned 10% to 20% of your portfolio into tangible assets, you may want to consider doing so after getting appropriate financial advice.
This week’s radio program features an interview with Dr. A. Gary Shilling.
We get Dr. Shilling’s take on the real estate market, as well as his forecast for stocks and bonds, moving ahead.
Dr. Shilling has been a long time “Forbes” columnist and is a returning guest expert to the program.
The interview is now available on the podcast which you can access through the RLA app.
If you don’t yet have the RLA app, you can download it by visiting www.RetirementLifestyleAdvocates.com.
The RLA app gives you free access to all our resources.
“Would a fly without wings be called a walk?”
“What if there were no hypothetical questions?”
-George Carlin


