
 Weekly Update from RLA Tax and Wealth Advisory
By: Dennis Tubbergen
Is the Stock Market Really Higher or Is the US Dollar Just Devalued?
Last week, both the Dow Jones Industrial Average and the Standard and Poor’s 500 made new all-time highs. To be accurate, both stock indexes made new all-time NOMINAL highs.
What do I mean by that?
Because stocks (like groceries and other consumer items) are priced in US Dollars, when the US Dollar is devalued or loses purchasing power, any item priced in US Dollars sees its price increase. It doesn’t matter if that item is groceries or stocks.
As I discuss at length in my in-person educational events, since financial market values and economic data are reported in US Dollars, when the US Dollar is devalued, the reported values in US Dollars are higher, at least in nominal terms.
But what about in real terms?
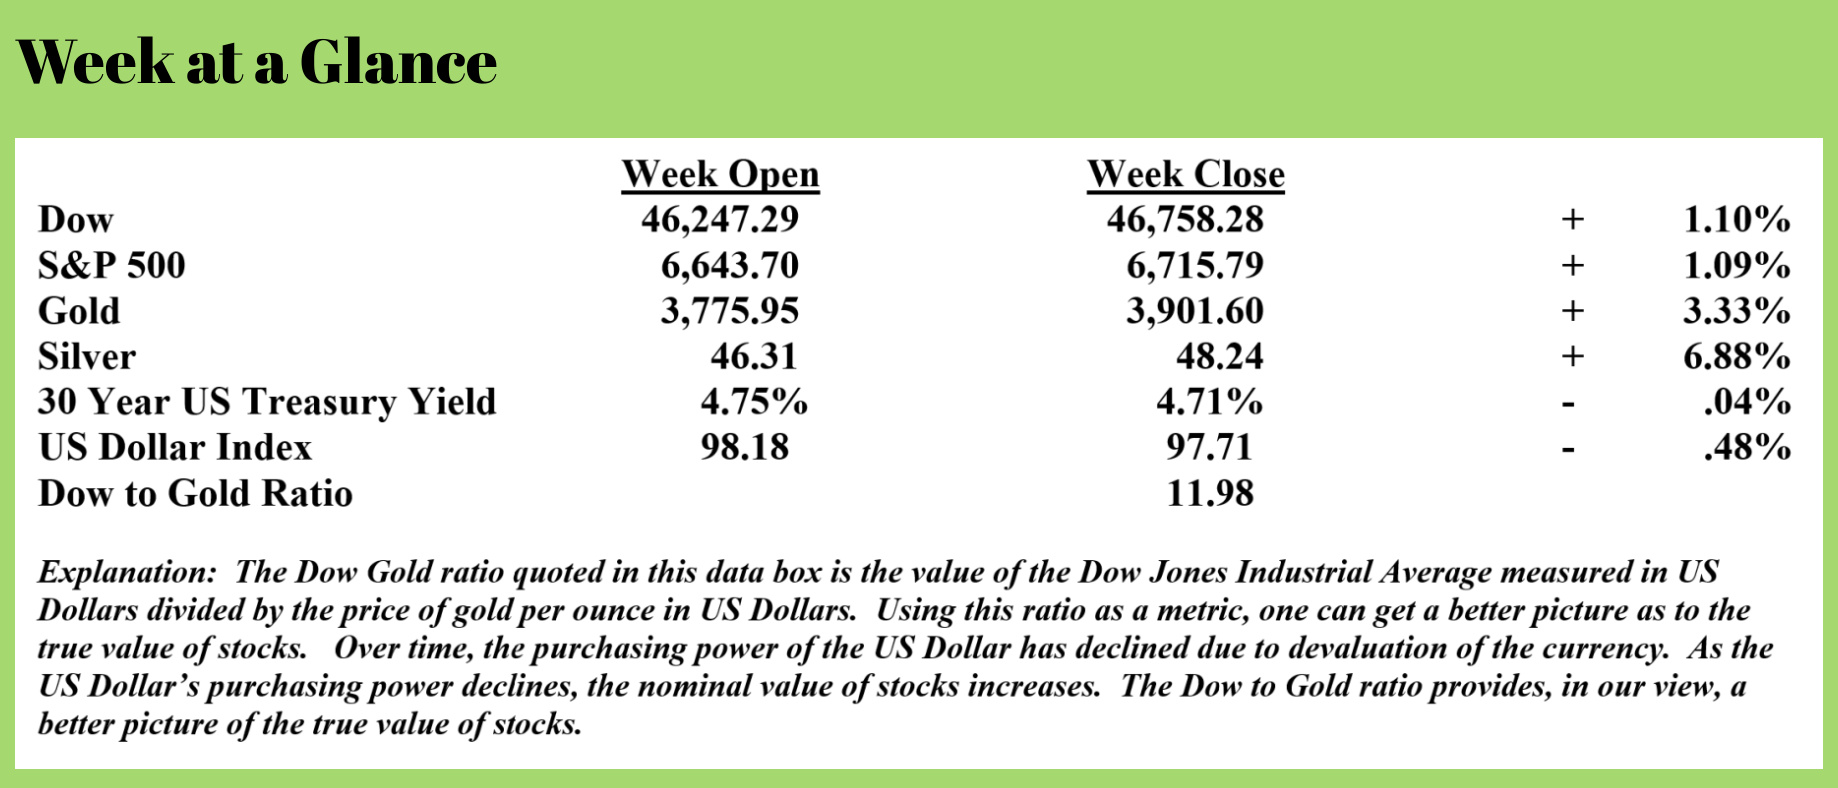
To price a grocery item or a stock market index in real terms, the best method to use is to price it in gold. For example, the Dow Jones Industrial Average closed at 46,758 last week; that’s the Dow priced in US Dollars.
Gold, priced in US Dollars, closed the week at about $3,900. To price the Dow Jones Industrial Average in gold, one would take the closing value of the Dow in dollars, 46,758, and divide by the price of gold per ounce in dollars, 3,900. That means the Dow Jones Industrial Average priced in gold is just under 12 (46,758/3900=11.99).
Now let’s go back in time to the calendar year 2000. The Dow Jones Industrial Average stood at 10,940, and gold was at $283 per ounce. Priced in gold, the Dow was 38 or about triple the current value.
In real terms, the Dow is down by 2/3rd’s over the last 25 years, even though it’s more than quadrupled nominally. That huge, gaping disparity is due to inflation.
One can even go back to 1929 at the market peak and see that when priced in real terms, stocks are lower now than nearly 100 years ago.
At the peak prior to the 1929 crash, the Dow Jones Industrial Average index was 381. At that time, the US Dollar WAS gold and was $20 per ounce. Priced in gold, in 1929 at the stock market peak, the Dow was about 19 ounces of gold. Compare that to about 12 ounces today.
More evidence of persistent inflation that has been with us as long as the Federal Reserve has been with us.
I expect this trend to continue and accelerate. If you haven’t yet adjusted your money management strategies and allocations for this trend, the time to do so is now.
Stocks Reach Milestone Valuation High
Another measure of stock valuations that provides a clearer picture of the value of stocks, also taking the US Dollar devaluation out of play, is an indicator called “The Buffett Indicator,” named for famed Omaha investor, Warren Buffett, who once stated it was his favorite stock valuation metric.
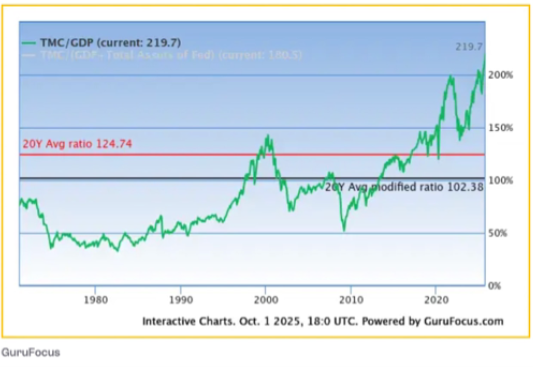 It’s very simple to construct the indicator. One takes the total capitalization (or total value) of stocks and divides by gross domestic product (or economic output). Since market capitalization is measured in US Dollars and gross domestic product is measured in US Dollars, this indicator effectively removes the devaluation of the US Dollar from the measurement.
The chart shows that the current value of the Buffett Indicator is now, once again, at an all-time high.
That tells us that there is likely a lot more downside risk in the current stock market than there is upside growth potential. Have you incorporated exit strategies into your portfolio to help protect from a stock market correction or crash?
Where Might Silver Go From Here?
At the beginning of 2025, I suggested to clients who had profits in gold that they take some of those profits and invest in silver, which had more upside growth potential in my view.
That recommendation has worked out very well, given that silver prices are up more than 50% year-to-date. By the way, I made this recommendation based on the ratio of the price of silver per ounce to the price of gold per ounce, which exceeded 110 at the beginning of the calendar year 2025. The historical ratio was about 50.
Now, with silver approaching $50 per ounce, which was the all-time high in 1980 and again in 2011, is the top in silver near?
While I expect that a price pullback or price consolidation here is likely, I think that there is a lot more upside for silver. The reason is simple.
Mike Maharrey recently suggested that when comparing the price of silver to the money supply, silver has a lot more upside potential. The ratio was more than 1030 in 1980, more than 175 in 2011, and now stands at just 66.
I agree. But silver purchases at these levels should be made strategically.
RLA Radio
The RLA radio program this week features an interview that I did with Mr. Martin Armstrong of Armstrong Economics. I pick Mr. Armstrong’s brain about the current economy, his forecasts for global financial markets, and global money flows. The podcast is now available by clicking on the "Podcast" tab at the top of this page.
Quote of the Week
“Humor is always based on a modicum of truth. Have you ever heard a joke about a father-in-law?”
-Dick Clark

Comments